Low-temperature green synthesis of boron carbide using aloe vera
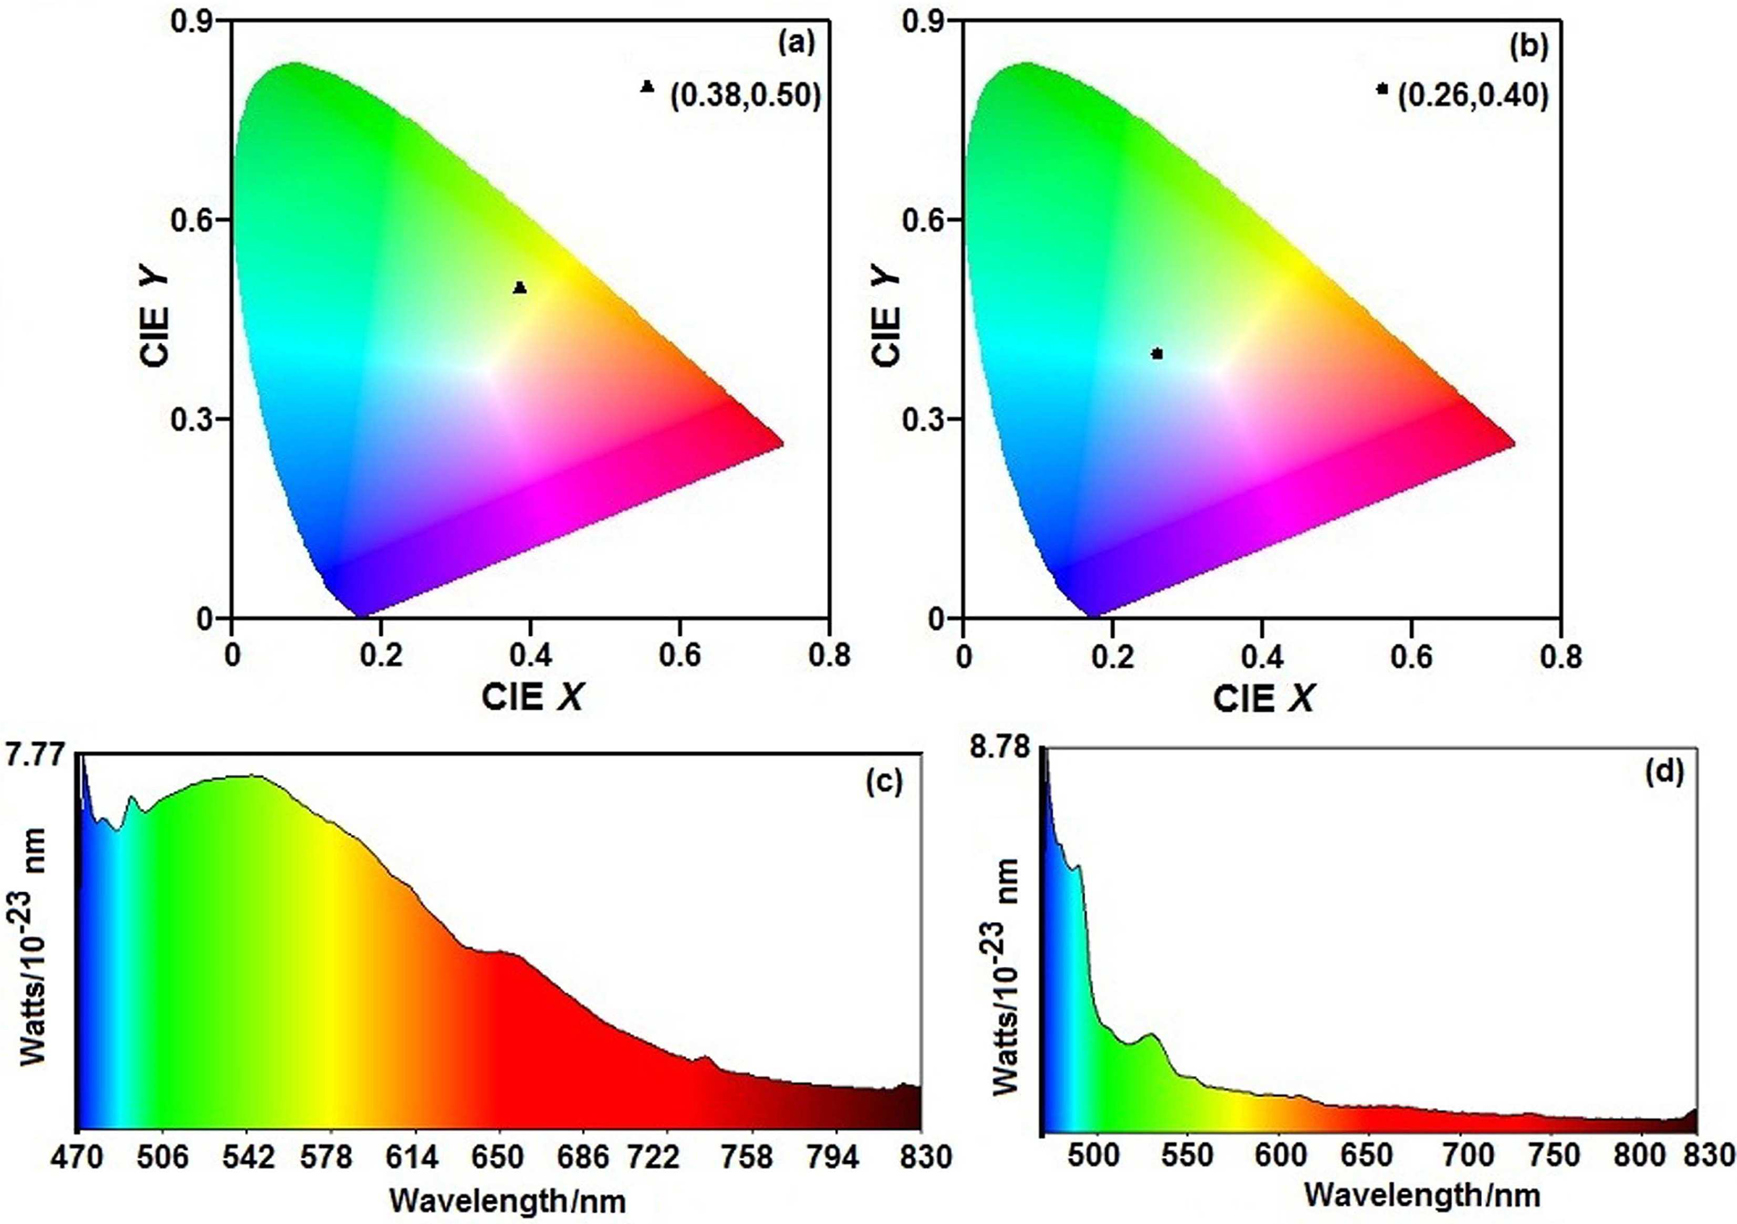
(color online) CIE plots of samples (a) K2 and (b) K3, and power spectra of samples (c) K2 and (d) K3.

Low-temperature green synthesis of boron carbide using aloe vera |
|
(color online) CIE plots of samples (a) K2 and (b) K3, and power spectra of samples (c) K2 and (d) K3. |
 |