Spin detection and manipulation with scanning tunneling microscopy
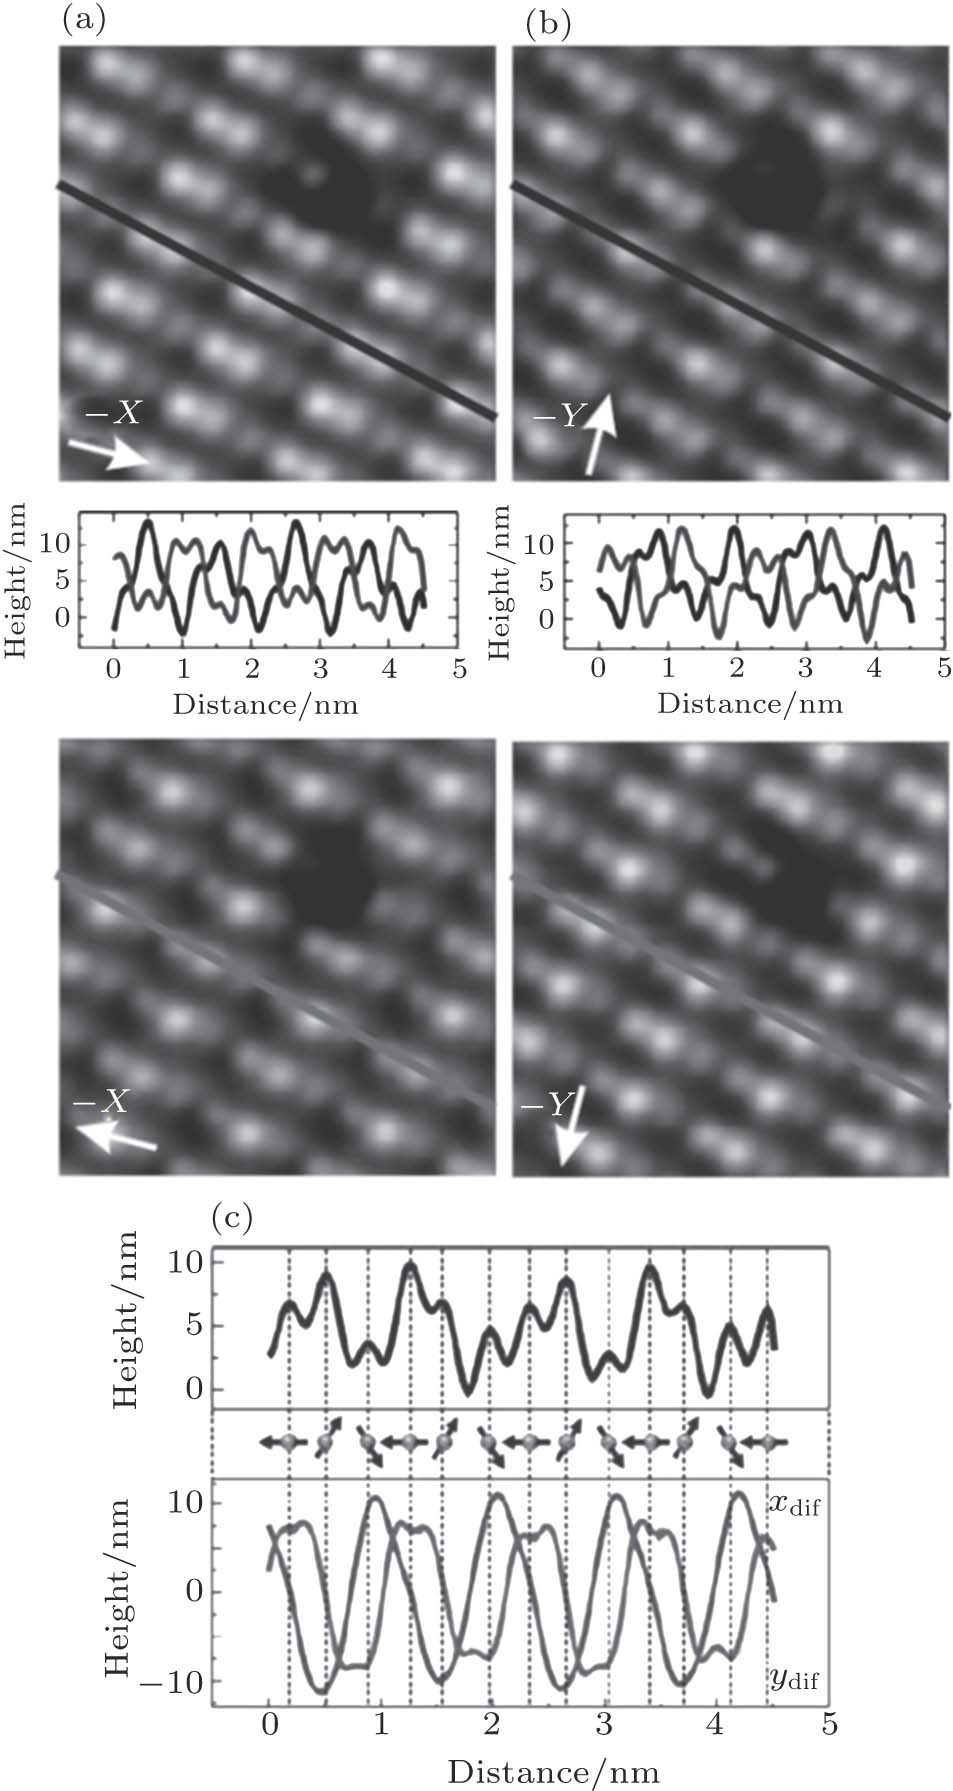
(a) and (b) Topographical images of a 4 nm × 4 nm region under an external field of X = +2T, X = −2T, Y = +2T, and Y = −2T, as marked in the images. Line profiles were drawn in the middle of panels (a) and (b). (c) The upper figure shows the topographic profile. The lower figure shows the magnetic components obtained by calculating the difference between the X and Y images. Arrows in the middle show the spin direction of each atom by taking a vector sum of the X and Y magnetic components.