Coherent structures over riblets in turbulent boundary layer studied by combining time-resolved particle image velocimetry (TRPIV), proper orthogonal decomposition (POD), and finite-time Lyapunov exponent (FTLE)
Li Shan1, Jiang Nan1, †, Yang Shaoqiong1, ‡, Huang Yongxiang2, Wu Yanhua3
School of Mechanical Engineering, Tianjin University, Tianjin 300072, China
Xiamen University, Xiamen 361102, China
Nanyang Technological University, Singapore 639798, Republic of Singapore


† Corresponding author. E-mail: nanj@tju.edu.cn shaoqiongy@tju.edu.cn

Project supported by the National Natural Science Foundation of China (Grant Nos. 11332006, 11732010, 11572221, and 11502066) and the Natural Science Foundation of Tianjin City (Grant No. 18JCQNJC5100).

Abstract

Time-resolved particle image velocimetry (TRPIV) experiments are performed to investigate the coherent structure’s performance of riblets in a turbulent boundary layer (TBL) at a friction Reynolds number of 185. To visualize the energetic large-scale coherent structures (CSs) over a smooth surface and riblets, the proper orthogonal decomposition (POD) and finite-time Lyapunov exponent (FTLE) are used to identify the CSs in the TBL. Spatial-temporal correlation is implemented to obtain the characters and transport properties of typical CSs in the FTLE fields. The results demonstrate that the generic flow structures, such as hairpin-like vortices, are also observed in the boundary layer flow over the riblets, consistent with its smooth counterpart. Low-order POD modes are more sensitive to the riblets in comparison with the high-order ones, and the wall-normal movement of the most energy-containing structures are suppressed over riblets. The spatial correlation analysis of the FTLE fields indicates that the evolution process of the hairpin vortex over riblets are inhibited. An apparent decrease of the convection velocity over riblets is noted, which is believed to reduce the ejection/sweep motions associated with high shear stress from the viscous sublayer. These reductions exhibit inhibition of momentum transfer among the structures near the wall in the TBL flows.

1. Introduction

Nature is full of examples of structures, materials, and surfaces that can offer the inspiration for possible commercial applications. During a period of four billion years evolution, different kinds of creatures in nature are gradually exhibiting their functional biological surfaces.[1] By investigating and understanding the mechanisms of their features, we may be able to reproduce these biological phenomena on demand.[2] For example, the super-hydrophobic and self-cleaning character on the surfaces of a lotus leaf or rice leaves demonstrates a remarkable effect on drag reduction;[3] birds have developed streamlined shapes to improve their flying performance;[1] and the scales covered on the shark skin inspire us potential ways to reduce the drag in fluid flows. However, among all of the inspirations that nature provides us, including active and passive controls to the turbulent flow,[47] shark-skin-inspired riblets are one of the few techniques that have been successfully used both in the laboratory and in the engineering application, to reduce the skin friction in TBLs.[8] In the 1984 Olympic rowing events, the riblets were used to raise the speed; in the 1987 and 2010 American’s Cup sailing competitions, the hulls of the USA challengers were fitted with riblets. Both challengers succeeded, although there is no proof whether riblets have any real role (so far).[9]

Early studies have been able to confirm about 6%–7% drag reduction,[10,11] up to 9.9% was achieved lately.[9,12,13] Several classes of riblets with easily manufactured shapes have been investigated by numerous researchers, including triangular, trapezoidal, rectangular, and circular-segment, and the studies of drag-reduction, as well as heat transfer, were conducted.[14] Previous results showed that the best drag reduction performance was achieved with longitudinal blade riblets when they were aligned in the flow direction.[10,15]

Vortical structures have gained much attention recently, because they are identified to play a predominant role in the spatial organization and energy exchanges, thus providing us different means to control them. Since initially proposed by Theodorsen,[16] the importance of hairpin or horseshoe-type vortices in the wall-bounded turbulent flows has become widely accepted. In the past few decades, numerous experimental and numerical studies on CSs in the TBL have also been carried out.[17,18] Robinson summarised the structures he commonly observed in direct numerical simulations: in the region very close to the wall, quasi-streamwise vortices are dominant structures; while in the wake region, arches or horseshoe vortices occur frequently, as well as a mixture of these two kinds of structures in the logarithmic layer (see Fig. 1(a)). Adrian et al.[19] firstly introduced the hairpin packet model to the TBL, as shown in Fig. 1(b); they conceived wall-bounded turbulence as a combination eddy, which was composed of a hairpin body (head) and two relatively short counter-rotating quasi-streamwise vortices (legs), with high/low-speed streaks between the legs in the buffer layer. To date, the entire understanding of hairpin-like structures and even controlling them is still a significant challenge, because the definition of the vortex remains unambiguous. Very recently, Elsinga et al.[20,21] discussed the auto-generation events of the hairpins in the TBL and turbulent channel flows, and found that the hairpin heads can be located as close as y+ = 30.
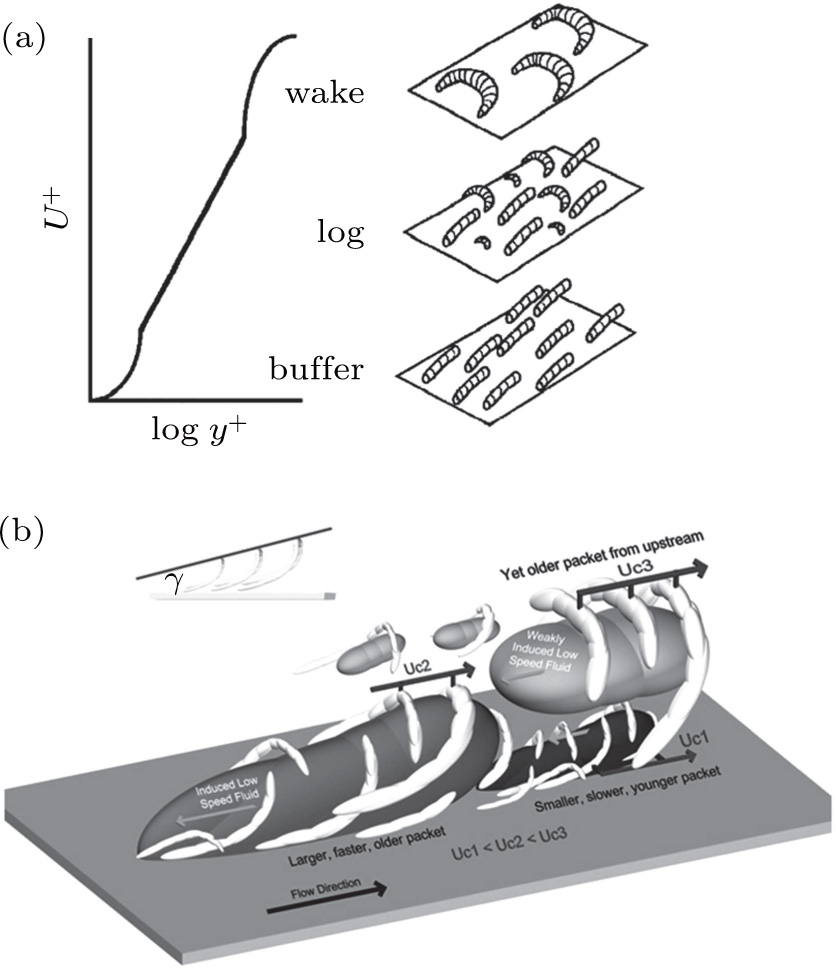
Fig. 1. (a) Robinson’s summary of structures found in the direct numerical simulation of wall turbulence;[18] (b) Hairpin-packet paradigm by Adrian et al.[19]

Several identification methods have been proposed to qualitatively describe the characterization of the coherent structures, including the wavelet transform,[2224] linear stochastic estimation (LSE),[25] conditional sampling,[26] and other techniques like the quadrant splitting methods[27] and IQSM.[28] All of these are conditional techniques, encountering the same problem of the dependence on a conditional criterion. Therefore, the proper orthogonal decomposition (POD) method as first introduced to study turbulence by Lumley,[29] and finite-time Lyapunov exponent (FTLE) presented by Haller[30,31] appear as the most promising alternatives. The POD is the first rigorous theoretical and mathematically unbiased approach for extracting CSs from the turbulent flows, and FTLE is based on the trajectory of the particles; both methods avoid the subjective threshold selection of the Eulerian criterion.

The particle image velocimetry (PIV) technique can, nowadays, measure the instantaneous velocity vector fields in a specific plane or volume of the flows, returning many outstanding results based on instantaneous and statistical structural analysis in the turbulent flows.[21,3234] This study is thereby motivated to investigate the drag reduction mechanism of riblets in detail using a time-resolved PIV (TRPIV) measurement system. In this paper, POD and FTLE methods are used to describe the topologies, spatial correlation, and convection velocity of the CSs in the TBLs at a friction Reynolds number Reτ = 185. Several interesting results are found from the application of FTLE to identify the coherent structures over smooth and riblets surfaces, and the mechanisms of the drag-reduction over riblets are studied from a different angle.

2. Experiment setup

The present experiment is conducted in the recirculation-type water tunnel with a cross section of 0.15 m × 0.14 m × 1.3 m (height × width × length) at Tianjin University; a TBL flow is developed along a horizontally mounted flat acrylic plate at the free-stream velocity Ue of 0.19 m/s. Two 1200-mm-long plates are prepared and used in the test, one at each time. The leading edge is elliptic. One plate is with smooth surface, while the other one is fabricated with continuous saw-tooth riblets on its tail parts, with the crests on the same plane with the upstream smooth wall. A spanwise zigzag band is placed 150-mm downstream of the leading edge to trigger the flow to a fully developed TBL. The physical peak-to-peak spacing of riblets, s, is 1.4 mm (see Fig. 2).

The working fluid is seeded with polyamide particles with a mean diameter of dp ≈ 10 μm and a density of 1.05 g⋅mm−3. A schematic of the experimental facility is illustrated in Fig. 2. The particles in the fluid are illuminated by a laser sheet with a thickness of about 0.8 mm, generated by a double-cavity Nd:YLF high repetition rate laser which is placed vertically to the plate. Pairs of single-exposure images are captured on a CMOS camera with a resolution of 1280 × 1024 pixels fitted with the zoom lens. The experimental temperature is maintained at 17 °C, with the freestream turbulence intensity less than 0.7%.

During the experiment, three sets of six thousand statistically independent snapshots for the planar velocity fields in a region of 101 mm× 81 mm (streamwise× wall-normal, xy) have been acquired with a sampling frequency of 250 Hz. The analysis process of the raw images is as follows: (i) firstly, the subtraction technique is applied to remove the background noise, eliminated the reflection of the light from the test plates; (ii) then, an interrogation window of 32 × 32 pixels with a 75% overlap rate is used for correlation calculation; and (iii) at last, range validation and average filter techniques are used to remove the noise from manufactured velocity fields. This whole process is performed with the Dantec Dynamics software. The velocity field has a spatial resolution of 0.643 mm in both x- and y- directions (∼ 6.7 viscous lengths, δν). The velocity measurement uncertainty of the whole system is estimated to be less than 1%.[26,35,36]

Fig. 2. (color online) Schematic of the experimental set-up and cross-section schematic diagram of the riblets.
3. Results and discussion
3.1. Base flow

Definition of the virtual origin at that wall-normal position is necessary for the comparison of results over riblets. Choi et al.[37] defined it as the wall-normal location of an imaginary smooth surface which has the same friction drag as the riblets and matches the riblets velocity profile above its viscous sub-layer. The location herein is taken to be 0.18 s lower than the riblets tip in y-direction.[10,15]

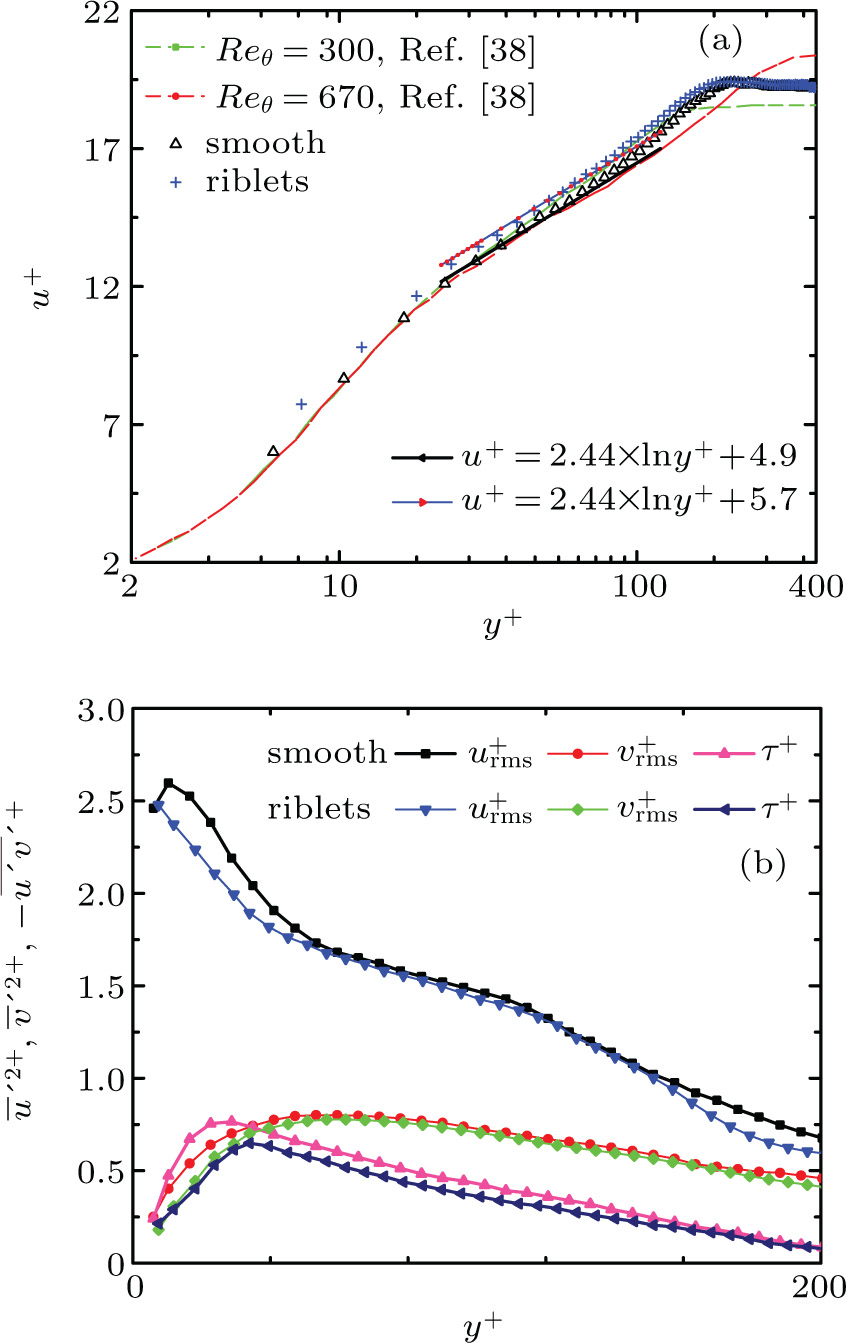
The basic parameters of the experimental flow are given in Table 1, where Reynolds number is based on friction velocity uτ and the thickness of the TBL δ, and DR represents the drag reduction rate. The mean velocity profiles normalized in wall units (WU) are plotted in Fig. 3(a), and the location in the streamwise direction is at x = 45.02 mm (x+ = 409 for smooth surface), about 1010 mm from the leading edge. The drag-reduction rate based on the friction coefficients herein is around 7.9%, which is higher than the results of 5.1% in Bechert et al.[15] Note that the space between riblet tips in WU s+ = s × uτ/ν = 14, the drag reduction rate , where τws, τwr are the shear stress for the smooth and riblet surface respectively, and uτs, uτr are their friction velocity. Besides, the DNS results at Reθ = 300 and 670 over a smooth surface[38] are also plotted in Fig. 3(a) to be compared with the present results at Reθ = 387 (Reynolds number Reθ is based on momentum thickness θ and free-stream velocity Ue). Friction velocity uτ is obtained herein using the Clauser chart method, with the whole calculation process discussed in detail by Fan and Jiang.[39] Through the error analysis with the mean velocity distribution in the log-law region (30 < y+ < 180), the error of uτ is within 1% in both cases.

Table 1.

Basic parameters and results.

.

As shown in Fig. 3(a), the buffer layer, log-layer, and wake region can be distinguished by their characteristic curvatures, and an upward shift in the logarithmic region is evident in the riblets case. This upshift and an increase of the buffer layer thickness have also been observed in the previous drag-reduced flow studies.[8,40,41] The velocity at near-wall area is much higher than that over the smooth surface, indicating that the riblets can efficiently reduce the friction drag. Turbulence intensities and the Reynolds shear stress −⟨uv′⟩, normalized by either uτs (for the smooth surface) or uτr (for riblets), are shown in Fig. 3(b). The reduction of all the turbulence statistics is evident in the riblets case, which is consistent with the previous experiment results,[4244] especially the streamwise component and τ.

Fig. 3. (color online) (a) Mean velocity (u+) profiles normalized by the wall units in the TBL flows over both surfaces. (b) Turbulence intensities and Reynolds stress profiles in the TBLs over both surfaces. Upper curve, urms/uτ; lower curve, ; middle curve, vrms/uτ.
3.2. Proper orthogonal decomposition analysis

Lumley[29] pioneered the use of POD to extract the structures in turbulent flows. This method utilizes a linear operation of temporal coefficients and spatial eigenfunctions to characterize complex unsteady flows. Since its basic functions are dependent on the flow field,[45] it is more physical than conditional-averaged vortex criterions mentioned above. In POD, the fluctuation velocity u′(x) from PIV data is approximately linearly expressed as

where an(t) are temporal coefficients and φn(x) are the spatial eigenfunctions or modes. The orthogonal basis functions φ(x) satisfy[46]

where C(x,x′) = ⟨u′(x)u′(x)⟩ is the 2-order space correlation. It is equivalent to solve the eigenvalue equation discretely

where λk is the eigenvalue corresponding to the k-rank eigenvector.

The POD can extract a complete set of orthogonal modes by maximizing the energy of modes, and it also gives the eigenvalues which correspond to the kinetic energy of each mode, thereby it has been widely used in various turbulent flows to extract the energy-containing structures and events.[47,48] There are 1000 instantaneous fluctuation velocity fields used in this paper for POD analysis to reveal the coherent structures over the test plates.

Fig. 4. POD energy distribution: (a) fractional contribution of each POD mode to the total energy; (b) cumulative energy distribution.

Figure 4 presents the normalized relative and cumulative energy of the POD modes for both surfaces; since the rank is always in decreasing order of contribution to the turbulent kinetic energy, the lower POD mode corresponds to the most energetic structures. The cumulative energy captured in the first ten modes decreases from 39% for the smooth plate to 32% over riblets, which indicates that the riblets have a noticeable effect on the large-scale coherent structures.[49]

After the fluctuation velocity field is decomposed into various scales of coherent motions, certain energy-containing structures in the flow can be obtained.[50] Figure 5 displays contours of several most energetic modes over smooth and riblet plates: the 1 st, 5 th, 10 th, and 15 th. The results show that the spatial structures are similar over both surfaces, exhibiting an inclined streaky pattern. While the inclination angle of these structures over riblets is reduced, it signifies that the wall-normal movement is suppressed, and so is the energy exchange.

Fig. 5. (color online) Contour plot of the eigenmode of the leading-order ith POD mode over test plates. From top to bottom: the 1 st, the 5 th, the 10 th, and the 15 th (left: smooth; right: riblets).
3.3. Finite-time Lyapunov exponent analysis

Previous studies on the vortex identification of the turbulent flows have primarily been the Eulerian methods which focus on the spatial shapes of the quantities derived from the instantaneous velocity fields and their gradients. However, when the transport in dynamical systems is taken into consideration, a Lagrangian method based on the pathline of the fluid particles is more objective. The Lagrangian criterion used in the present study is the finite-time Lyapunov exponent (FTLE) method.[30,31] Shadden[51] gives a precise definition of the FTLE method, i.e., considering a time-dependent velocity field u (x,t) defined on D, then a trajectory starting at (x0, t0) will be the solution of

If the initial time t0 and the final time t are fixed, as the time evolves, solutions of Eq. (4) can be defined as a flow map , which takes a point in the domain at time t0 to its location at time t. To put it simple, the FTLE is a scalar value which characterizes the integrated separation between trajectories of two neighboring particles advected with the flow.[51] Consider an arbitrary point xD at time t0, and a point very close to x, which is denoted as y = x + δx(0), then the perturbation after a time interval T changes to

where O(|δx(t0)||2) comes from the Taylor series expansion and is too small that it can be ignored here. So the magnitude of δx(t0 + T) will be

where M* denotes the adjoint of M.

According to the mathematical theorem, the maximum stretching between points x and y will occur when δx(0) is aligned with the eigenvector accosiated with λmax(Δ), therefore we define

where

is Cauchy–Green deformation tensor.

Equation (7) represents the FTLE of x0 with a finite time interval T. Note that the FTLE measures the average rather than instantaneous separation rate of the particle trajectories. Thus it is more indicative of the actual transport behaviors in the flow. In the present study, particle trajectories x(t) are extracted from the velocity sequence measured by the TRPIV, and each particle in space is advected with a fourth-order Runge–Kutta algorithm to integrate the time-resolved velocity fields.

To comparatively study the Lagrangian coherent structures (LCSs) in the TBL over both surfaces, the first few POD modes are used to reconstruct the most energy-contained structures in the flows to determine the evolution of the FTLE fields; POD serves as the low-pass filter here. In the present study, the first 311 eigenmodes for the smooth surface and 280 modes for riblets are used to reconstruct the velocity field, which contributes to approximately 90% of the turbulent kinetic energy (TKE). As previously interpreted, the LCSs to be discussed herein are identified by FTLE method with an integration time T = −4 s. Figure 6 depicts contours of typical FTLE fields of all available 1000 eigenmodes and the linear combination of the dominant modes of the velocity field in both cases. By comparison of Figs. 6(a), 6(c) and 6(b), 6(d), small scale structures in the flows have been filtered out, but the large scale structures are almost the same in this certain period of time, which means that the POD-based filter level, 90% of the TKE, is justified to be used as the resulting flow field to extract the LCS information. The vector of the original velocity field is illustrated in Fig. 7, with the convection velocity Uc of 0.85Ue removed. Comparing to Fig. 6(a), the rotating pattern of the hairpin heads is revealed by FTLE properly.

More specifically, as shown in Figs. 6(b) and 6(d), the hairpin vortices are captured by the FTLE fields in the reconstructed flow domains. They nicely delineate an inclined streaky or hairpin-like vortex pattern, with their upstream portion (legs) attaching with the wall, the downstream portion (heads) rising in the y direction, and the heads of the hairpins forming half-closed ring-like structures, all of which show excellent agreement with Robinson’s summary in Fig. 1(a). Such pattern is also visualized in the FTLE fields where Green et al.[52] has identified the isolated hairpin vortices in their numerically simulated turbulent channel flows.

Fig. 6. (color online) Typical snapshots of the FTLE field distribution in the xy plane in the TBLs: linear combinations of (a) and (c) all available modes over smooth surface and riblets, respetively; (b) the first 311 modes for the smooth surface; and (d) the first 280 modes for riblets.
Fig. 7. (color online) Vector of the original velocity at the same T over smooth surface; the moving speed of the reference frame is Uframe = 0.85Ue.

Adrian originally proposed a hairpin-packet paradigm, suggesting a set of several hairpin vortices organized in coherent packets; figure 1(b) depicts all the important elements involved in the model. Adrian et al.[53] suggested that in the TBL, hairpins are the most common structures in the log-law layer; but with the increasing y+, the occurrence becomes less frequent, while the scales of the structures grow. All these characters are consistent with the current results, especially for the case over the smooth surface. However, the hairpin vortices over riblets are more independent of each other, with no evident hairpin packets observed. Since the growth of the packet involves several mechanisms, including self-induction, auto-generation, and mergers with other packets, it is reasonable to believe that the riblets have a remarkable effect on the growing process. The same conclusion has also been obtained in the DNS study over blade riblets, and it is believed that the smaller streamwise vortices generated in the riblets interact with and weaken the legs of the hairpin vortices, resulting in weaker streak structures and inhibiting the regeneration process.[54]

3.3.1. Space correlation of LCSs

As previously mentioned, the identified LCS in the TBL presents an inclined streaky pattern which is attached to the wall in the upstream, with an inclination angle α. Therefore, α is a critical parameter to characterize the spatial organization of LCSs; it can be calculated from the two-point correlation analysis of the FTLE fields, which is defined as

where Δx and Δy are the spatial separations in the x and y directions, respectively, and σA and σB are the root-mean-square (r.m.s.) of the FTLE fields.

Figure 8 presents four sets of RFTLE,FTLE(x0,y0xy) contours in the xy plane for the smooth and riblet flows. The reference points chosen here are consistent in the x direction, but varying from to 150 in the y direction. In order to get the same y+ over these two surfaces, the physical location is different considering the virtual origin over riblets. As shown in these figures, the qualitative difference between RFTLE,FTLE over these two surfaces is small, both elongating in the x direction and slightly inclined downstream away from the wall. Such characteristic topology may be identified by ridges in the RFTLE,FTLE field, and α is calculated by the inclination between the ridges of the RFTLE,FTLE field and the wall. The α over two different plates is similar in magnitude, so the hairpin vortex over smooth-surface is not fairly changed by the riblets from a structural point of view. However, the quantitative contrast of the α in both cases reveals some differences at different regions of the TBLs over these two surfaces. In particular, at y+ ≈ 20, the streamwise extent of RFTLE,FTLE field is reduced due to the presence of riblets. According to the previous studies,[55] the streamwise-elongated character is related to the streamwise alignment of vortices into larger-scale packets. That means, the characteristic length scales of these large-scale structures is appreciably decreased over riblets, which can be visually observed in Fig. 5 as well.

More specifically, all those RFTLE,FTLE contours in Fig. 8 show the same pattern at y+ ≤ 150 for both surfaces. However, when y+ > 150, the structures exhibit as a totally different character, which is more likely related to the heads of hairpin vortex. A plot of α of these LCSs against y+ for both cases is illustrated in Fig. 9. The values of α over smooth surface increase gradually with y+ at first, and then present a continuous decline beyond y+ = 100, with the value of α about 32°. This observation is consistent with the previous results in the TBL flow of Pan et al.[56] The authors reported that the instant LCSs inflected towards the wall at about y+ = 100, and believed this is the position where hairpins transit from neck to head. Zhou et al.[57] proposed an auto-generated model for the hairpin evolution, suggesting that once the hairpin vortices are generated, they lift the quasi-streamwise vortices and create new hairpins in the upstream. Therefore, the reduction of α over riblets at y+ ≥ 60 indicates a decrease of the energy transportation in the log-law layer of the TBL flows over riblets, thereby resulting in the drag reduction over riblets.

Fig. 8. (color online) Correlation coefficients of the Lyapunov exponents in the xy plane for smooth and riblets surface.
Fig. 9. (color online) Wall-normal distribution of the inclination angles of LCSs.
3.3.2. Convection velocity of the LCSs

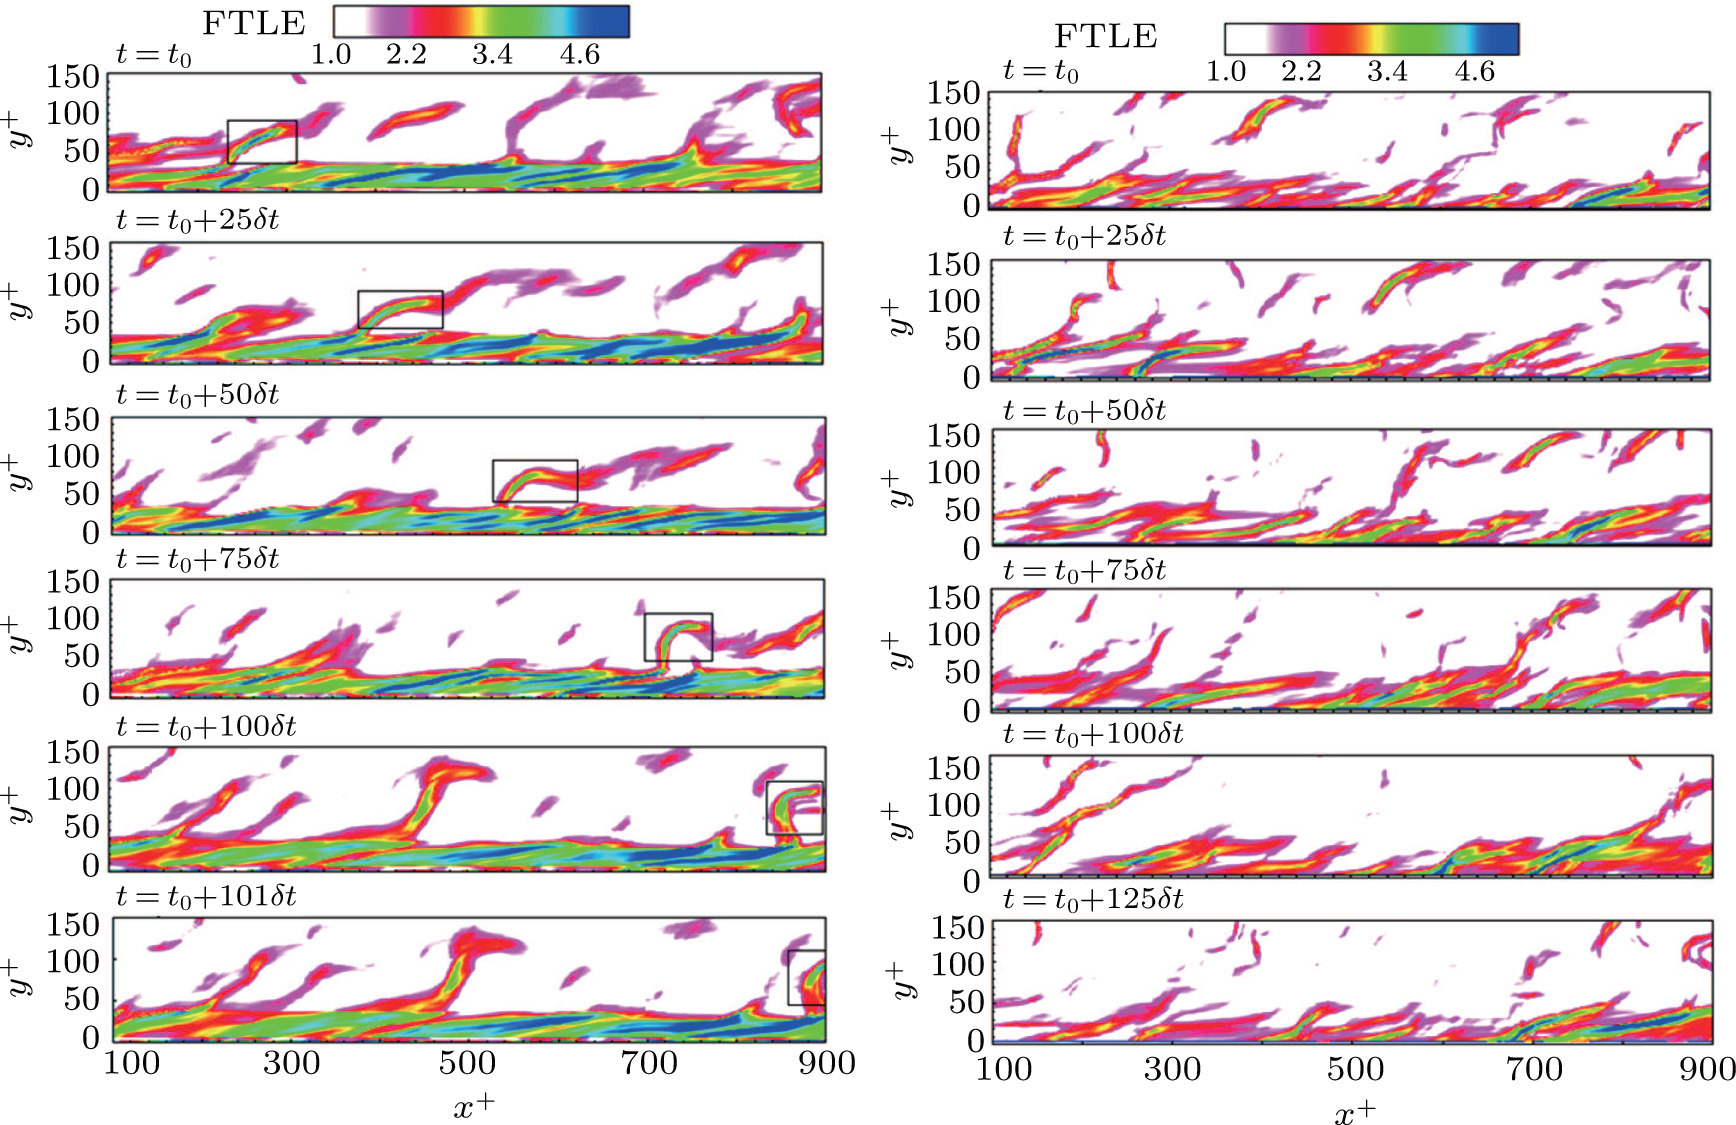
Figure 9 presents a time series of FTLE fields, illustrating the evolution process of LCSs over the smooth and riblets surfaces with the time step δt = 0.004 s. The initial time t0 chosen here provides the best insights of the structure evolution in the flow. As shown in Fig. 10, the formation of a new hairpin-like structure over the smooth surface can be distinctly observed from t = t0 to t = t0 + 100δt in the FTLE fields. At t = t0, the hairpin vortex only appears as inclined streaks; at t = t0 + 25δt, the streaks lift up and start to roll up when they are advected downstream; from t = t0 + 50δt to t = t0 + 75δt, the process of rolling-up is proceeded, indicating the intense vorticity concentration at the head of the hairpin vortex. The whole process is almost completed at t = t0 + 100δt. The generation process of the hairpin vortex is very similar to the phenomenon described by Zhou et al.[57] and fairly recently modified with confirmation by Elsinga et al.[58,59] Different from its smooth counterpart, there is no noticeable complete process of hairpin/hairpin packet generation that arises in the TBL flows over riblets.

Furthermore, Taylor frozen hypothesis has been widely used to obtain the convection velocity of CSs in turbulent flows, which suggests that the spatial patterns of CSs are passing a fixed point without any essential entail.[60] The classical Taylor hypothesis simplifies the space-time correlation to the space correlation via

where C is the correlation function normalized by the r.m.s of velocity fluctuations, r is the space separation, τ is the time delay, and is the local streamwise mean velocity.

The downstream convection velocity of typical LCSs between two points, A and B, can be calculated by the space-time correlation of the FTLE fields, which is defined as

where σA and σB denote the r.m.s. values, and τ is a specific time delay.

Fig. 10. (color online) Time evolution of a typical FTLE field over a smooth surface (left) and riblets (right), (δt = 0.004 s).

In this case, points A and B are aligned in the streamwise direction; while the relative distance between these two points is Δx = 11.13 mm (, ). The evolution of RFTLE, FTLE (x0, y0, Δx, τ) as a function of τ+ is shown in Fig. 11(a), where point A and B are located at xA = x0 = 48.3 mm (, ), ; xB = x0 + Δx = 59.43 mm (, ), . The function of RFTLE,FTLE over smooth and riblets surfaces exhibits a distinct peak at t = τp and τr respectively, and then drops off. The time delay at this peak is taken as the characteristic transporting time for the typical LCSs between points A and B. If the relative distance Δx between these two points is small enough, the streamwise convection velocity Uc can be approximated represented by Δx/τp (or Δx/τr). Figure 11(b) represents their profiles of Uc over these two different surfaces against y+, and Uc is normalized by Ue. The distribution of Uc(y+) over smooth plate is in close agreement with the local mean velocity in the x direction, especially at y+ > 40.[56] While the convection velocity of the LCSs over riblets is, in general, much smaller than that for the smooth case, this means that the typical LCSs move slower in the TBL flow due to the presence of riblets. Besides, Δτ = τrτp becomes more evident with the increasing y+. There are two reasons speculated for this phenomenon. 1) The decreasing convection velocity over riblets indicates that the hairpin-like vortices are presumably pinned at near the riblet tips, which is believed to make the turbulent bursting events less activate at the near wall region, and this confirms the suggestion proposed by Bhushan;[2] 2) the amount of the LCSs over riblets is reduced, and the formation of the hairpin-like vortex is somehow disrupted/hampered, which will be investigated further in the future. But whichever the reason is, the transport of momentum over riblets is reduced since the convection of hairpins vortices is critical in turbulence transport properties.

Fig. 11. (a) Illustration of spatial-temporal correlation of typical LCS at x0 = 48.3 mm, Δx = 11.13 mm, ; (b) convection velocities of the LCSs in TBL flows over both surfaces.
4. Conclusions

Time-resolved velocity fields of turbulent boundary layer over smooth and riblets are acquired using TRPIV measurement to investigate the mechanism of drag-reduction caused by riblets. Dominant CSs in the TBL flow over different plates are identified by POD and FTLE methods, and further study of the spatial scale and evolution of hairpin vortex gives the conclusions below:

(i) The mean velocity profile over the smooth surface matches very well with the DNS results. The drag-reduction rate based on the friction coefficients is 7.9%.

(ii) POD results present that riblets have marked effect on the gross features of large-scale structures in the TBL flows, and the wall-normal movement of the most energy-containing structures are suppressed over riblets, thus reducing the momentum and energy exchange.

(iii) Snapshots of recovered instantaneous velocity realization in the xy plane nicely delineate the hairpin-like vortex packets in the TBL flows over both surfaces, indicating that the hairpin vortex over riblets is not significantly changed from a structural point of view. Within the dimension of riblets studied in this paper (s+ = 14), the vortices are believed to be lifted from the surface, which reduces the drag over the surface.

(iv) Besides, the inclination angle of LCSs is significantly increased for the flow over riblets, especially in the buffer layer, which implies a noticeable decrease of the contact area between the legs of hairpins and the surface. It thereby results in the drag-reduction. The evolution process of LCSs over the smooth surface illustrates the formation of a new hairpin-like structure, while no noticeably complete auto-generation process of the hairpin/hairpin packets is observed over riblets. Through comparison of the convection velocity Uc of LCSs, it is demonstrated that LCSs are advected much slower over riblets surface than over the smooth surface. Two explanations are speculated for this result, and the hairpin-like vortices are either presumably pinned at near the riblet tips, or disrupted/hampered by the exist of riblets; the transport of momentum over riblets is reduced no matter which reason is responsible in fact.

Reference
[1] Luo Y Yuan L Li J Wang J 2015 Micron 79 59
[2] Bixler G D Bhushan B 2013 J. Colloid Interf. Sci. 393 384
[3] Tian H Zhang J Jiang N Yao Z 2015 Exp. Therm. Fluid Sci. 69 27
[4] Zheng X Jiang N Zhang H 2016 Chin. Phys. 25 014703
[5] Zheng X B Jiang N 2015 Chin. Phys. 24 064702
[6] Zou L Bai J Li B Tan D Li P Liu C 2008 Chin. Phys. 17 103407
[7] Yang H Hui Z Baochun F Jian L Daiwen J Zijie Z 2017 Chin. Phys. 26 084704
[8] Choi K 1989 J. Fluid Mech. 208 417
[9] Garcia-Mayoral R Jimenez J 2011 Phil. Trans. R. Soc. 369 1412
[10] Bechert D W Bartenwerfer M 1989 J. Fluid Mech. 206 105
[11] Bechert D W Bruse M Hage W 2000 J. Fluid Mech. 28 403
[12] Dean B Bhushan B 2010 Phil. Trans. R. Soc. 368 4775
[13] Martin S Bhushan B 2014 J. Fluid Mech. 756 5
[14] Choi K S Orchard D M 1997 Exp. Therm. Fluid Sci. 2 109
[15] Bechert D W Bruse M Hage W van der Hoeven J G T Hoppe G 1997 J. Fluid Mech. 338 59
[16] Theodorsen T 1952 Proceedings of Second Midwestern Conference on Fluid Mech
[17] Cantwell B J 1981 Ann. Rev. Fluid Mech. 1 457
[18] Robinson S K 1991 Ann. Rev. Fluid Mech. 23 601
[19] Adrian R J Meinhart C D Tomkins C D 2000 J. Fluid Mech. 422 1
[20] Jodai Y Elsinga G E 2016 J. Fluid Mech. 795 611
[21] Westerweel J Elsinga G E Adrian R J 2013 Ann. Rev. Fluid Mech. 409 10.1146/annurev-fluid-120710-101204
[22] Jiang N Zhang J 2005 Chin. Phys. Lett. 22 1968
[23] Liu J Jiang N Wang Z Shu W 2005 Appl. Math. Mech. 26 495
[24] Hu H Du P Huang S Wang Y 2013 Chin. Phys. 22 074703
[25] Adrian R J 1994 Appl. Sci. Res. 53 291
[26] Tang Z Q Jiang N 2012 Exp. Fluids 53 343
[27] Wallace J M 2016 Annu. Rev. Fluid Mech. 48 131
[28] Yang S Jiang N 2012 Sci. Chin. Phys. Mech. Astron. 55 1863
[29] Lumley J L 1967 Atmospheric Turbulence and Radio Wave Propagation 166
[30] Haller G 2001 Phys. Fluids 13 3365
[31] Haller G 2002 Phys. Fluids 14 1851
[32] Adrian R J Christensen K T Liu Z C 2000 Exp. Fluids 29 275
[33] Christensen K T Adrian R J 2001 J. Fluid Mech. 431 433
[34] Lee S J Lee S H 2001 Exp. Fluids 153 10.1007/s003480000150
[35] Prasad A K Adrian R J Landreth C C Offutt P W 1992 Exp. Fluids 105 10.1007/BF00218156
[36] Adiran R J Westerwell J 2011 Particle Image Velocimetry Cambridge Cambridge University Press
[37] Choi H Moin P Kim J 1993 J. Fluid Mech. 255 503
[38] Spalart P R 1988 J. Fluid Mech. 187 61
[39] Fan X Jiang N 2005 Mech. Engin. 01 28 in Chinese
[40] Wang J Lan S Chen G 2000 Fluid Dyn. Res. 27 217
[41] Cui G Pan C Gao Q Li L J 2017 Chin. J. Theor. Appl. Mech. 06 1201 in Chinese
[42] J W M 1980 Viscous Drag Reduction 168 10.2514/5.9781600865466.0168.0184
[43] Yang S Li S Tian H Wang Q Jiang N 2016 Acta Mech. Sin.-Prc 32 284
[44] Yang S Q 2015 Particle Image Velocimetry Investigation of Coherent Structures in Wall-bounded Turbulent Flows and Their Passive Control by Riblets Ph. D. Thesis Tianjin Tianjin University
[45] Wang W Guan X Jiang N 2014 Chin. Phys. 23 104703
[46] Chatterjee A 2000 Curr. Sci. 78 808
[47] Liu Z Adrian R J Hanratty T J 2001 J. Fluid Mech. 448
[48] Pan C Wang H Wang J 2013 Meas. Sci. Technol. 24 55305
[49] Wu Y 2014 Phys. Fluids 26 45113
[50] Zhong Q Li D Chen Q Wang X 2012 Journal of Tsinghua University 6 2 Science and Technology
[51] Shadden S C Lekien F Marsden J E 2005 Phys. D: Nonlinear Phenom. 212 271
[52] Green M A Rowley C W Haller G 2007 J. Fluid Mech. 572 111
[53] Adrian R J 2007 Phys. Fluids 19 41301
[54] Klumpp S Meinke M Schröder W 2010 Flow Turbul. Combust. 85 57
[55] Tomkins C D Adrian R J 2003 J. Fluid Mech. 490 37
[56] Pan C Wang J Zhang C 2009 Sci. Chin. Ser. G: Phys. Mech. Astron. 52 248
[57] Zhou J Adrian R J Balachandar S Kendall T M 1999 J. Fluid Mech. 387 353
[58] Goudar M V Breugem W Elsinga G E 2016 Phys. Fluids 28 35111
[59] Jodai Y Elsinga G E 2016 J. Fluid Mech. 795 611
[60] Taylor G I 1938 Proc. R. Soc. Lond. 476