Transport spectroscopy through dopant atom array in silicon junctionless nanowire transistors
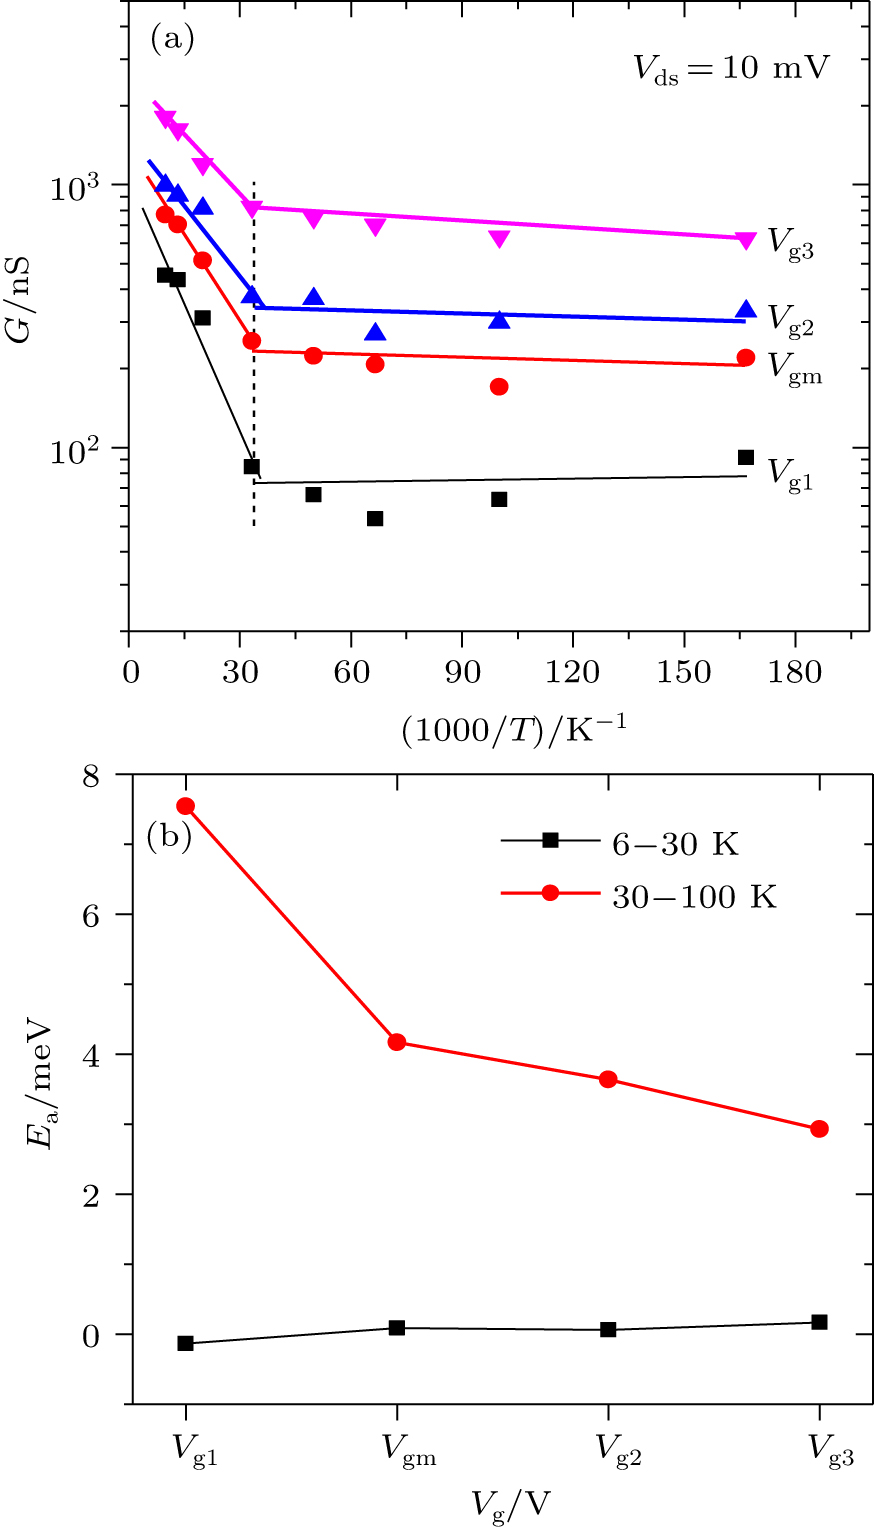
(color online) (a) Arrhenius plots of conductance at various gate voltages, which correspond to maximum peaks at Vgm and three valleys Vg1, Vg2, Vg3 in the transconductance curves of Fig.