Numerical tests of theoretical models describing ionization of H(1s) atom by linearly polarized flat pulse of laser radiation
Project supported by the University of Łódź.
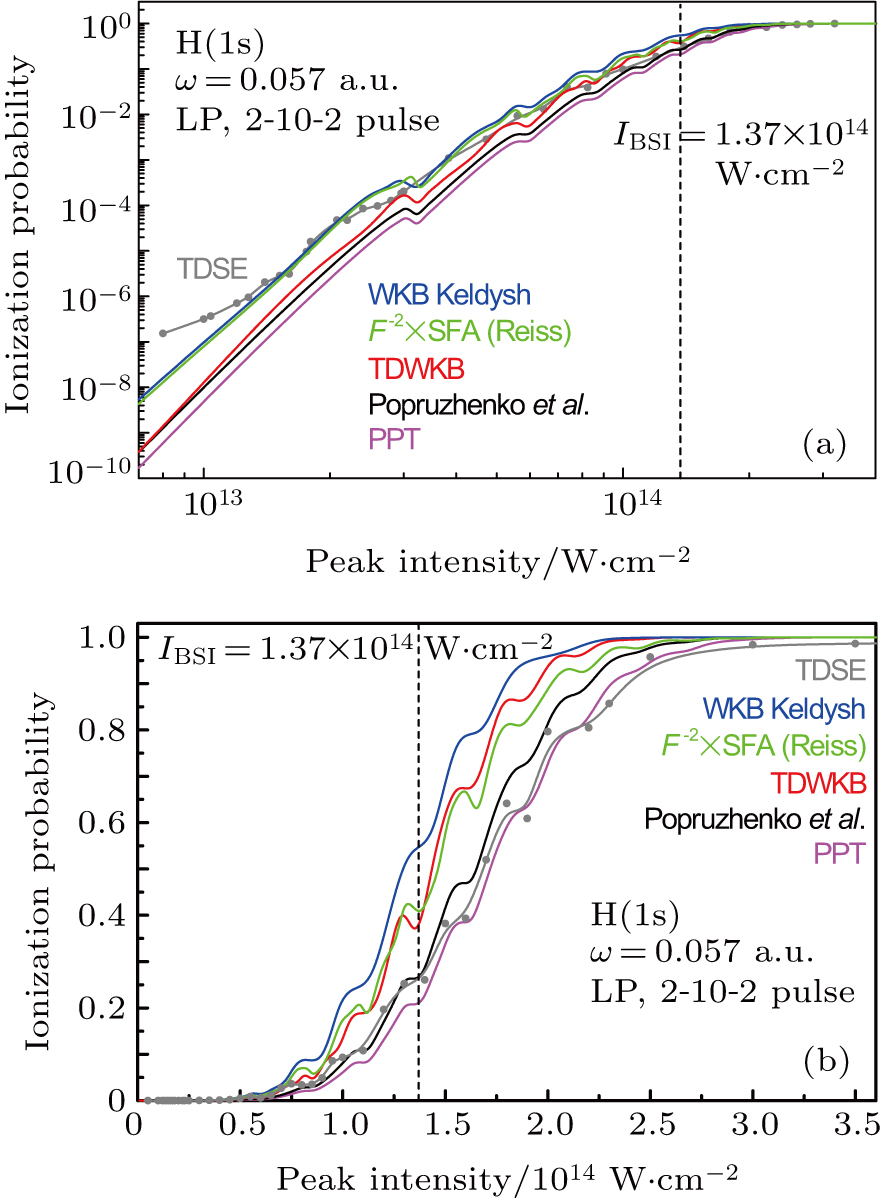
(color online) Plots of probability of ionization of H(1s) atom after the end of the laser pulse versus peak intensity for ω = 0.057 a.u. Gray solid curve denotes exact numerical TDSE results. Other five curves are obtained by integrating over time ionization rates. Colors of respective curves are the same as in Figs.