Generation and evolution of multiple operation states in passively mode-locked thulium-doped fiber laser by using a graphene-covered-microfiber
Wang Xiao-Fa, Zhang Jun-Hong, Peng Xiao-Ling, Mao Xue-Feng
College of Optoelectronic Engineering, Chongqing University of Posts and Telecommunications, Key Laboratory of Optical Fiber Communication Technology, Chongqing Education Commission, Chongqing 400065, China


† Corresponding author. E-mail: wangxf@cqupt.edu.cn

Project supported by the National Natural Science Foundation of China (Grant Nos. 11304409 and 61705028), the Natural Science Foundation of Chongqing City, China (Grant Nos. csct2013jcyjA4004 and cstc2017jcyjA0893), the Scientific and Technological Research Program of Chongqing Municipal Education Commission, China (Grant No. KJ1500422), and the Postgraduate Research Innovation Foundation of Chongqing City, China (Grant No. CYS17240).

Abstract

Using graphene-covered-microfiber (GCM) as a saturable absorber, the generation and evolution of multiple operation states are proposed and demonstrated in passively mode-locked thulium-doped fiber laser. The microfiber was fabricated using the flame brushing method to an interaction length of ∼ 1.2 cm with a waist diameter of ∼ 10 μm. Graphene layers were grown on copper foils by chemical vapor deposition and transferred onto the polydimethylsiloxane (PDMS) to form a PDMS/graphene film, which allowed light-graphene interaction via evanescent field. With the increase of the pump power from 1.25 W to 2.15 W, five different lasing regimes, including continuous-wave, conventional soliton mode-locking, multi-soliton mode-locking, a period of transition, and noise-like mode-locking, were achieved in a fiber ring cavity. To the best of our knowledge, it is the first report of the generation and evolution of multiple operation states by covering graphene on the microfiber in the 2-μm region. The results demonstrate that GCM can be a promising method for fabricating all fiber SA, and the switchable operation states can provide more portability in complex application domain.

1. Introduction

Thulium-doped fiber lasers (TDFLs), owing to their wide applications in remote sensing, optical communication, laser medical system, and gas sensing, have attracted considerable interest.[1] At present, passively mode-locked TDFLs incorporating an artificial or real saturable absorber (SA) have been primarily used as novel laser sources.[211] Among these mode-locking techniques, nonlinear polarization rotation (NPR)[2] and nonlinear amplification loop mirror (NALM)[3] mode-locking have the characteristic of a high damage threshold but are extremely sensitive to environmental fluctuations. Usually, such drawbacks are not desirable in applications of medical treatment and scientific research. Recently, graphene,[47] carbon nanotubes (CNTs),[8] transition metal dichalcogenides (TMDs),[9] topological insulators (TIs),[10] and black phosphorus[11] are being considered as a kind of potential SA for passively mode-locked TDFL. Among them, graphene has become the focus of attention from many researchers because of its many features including low saturable absorption threshold, controlled modulation depth, ultrafast recovery time (100 fs–200 fs), wide spectrum range (300 nm–2500 nm), and easy integration with optical system, which make it stand out in all kinds of mode-locking materials.

Up to now, the use of graphene as an SA has been demonstrated in passively mode-locked TDFL.[47,1220] The structure of SA is fabricated using two common methods, i.e., by coupling graphene films[47,1214] and nanomaterial[20] on the fiber ferrules of the connector to form an SA of the sandwich structure, or by using the evanescent field occurring on the waist of the microfiber[15,16] or side-polish fiber[1719] to interact with the graphene. The SA of sandwich structure has its limitations, such as low thermal damage threshold, weak optical absorption, and high insertion loss, which make it unsuitable in a complex natural environment. By contrast, only a small part of the light is required to interact with graphene covered on the microfiber or side-polish fiber. Thus, this structure has many advantages of fast cooling speed, high damage threshold, and compact all-fiber structure in applications of high power fiber lasers. Meanwhile, there are some drawbacks for the use of side-polished fiber-based graphene saturable absorber (GSA), such as difficulties in obtaining a perfect smooth surface. Compared with the side-polished fiber, the microfiber has a simple fabrication process and good symmetry structure by using the mature flame brushing technique. Although the applications of integrated microfiber and graphene as an SA have been reported to generate mode-locking pulses in the fiber laser, most of these works have focused on short-wavelength regions[2123] and fiber optic sensors.[24] Thus the study of microfiber-based GSA in the 2-μm mode-locked fibers is still very limited[15,16] and the operation states of output pulses are relatively monotonous in the cavity.

In this paper, we report a passively mode-locked TDFL based on a graphene-covered-microfiber (GCM), which is fabricated by combining polydimethylsiloxane (PDMS)-supported monolayer graphene film and microfiber. By increasing the pump power from 1.25 W to 2.15 W, TDFLs obtain different operation states including continuous-wave (CW), conventional soliton mode-locking (CSML), multi-soliton mode-locking (MSML), a period of transition, and noise-like mode-locking (NLML). All-fiber structure of GCM device allows power scalability with the potential of high power mode-locking operation. Then the operation of switchable fiber lasers can provide more portability in a wide range of applications.

2. Fabrication and characterization of the GCM
2.1. Fabrication of microfiber

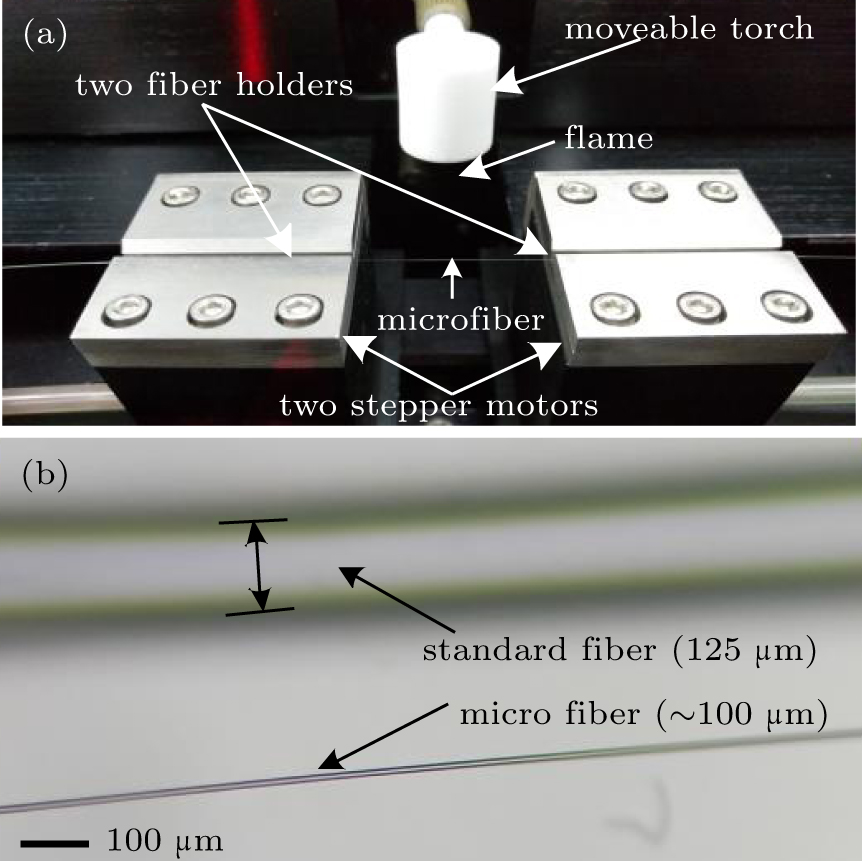
A commercial fiber taper system (SCS-4000) and flame brushing technique are used to fabricate the microfiber, as shown in Fig. 1(a). The taper system consists of two fiber holders, two stepper motors, a moveable torch, a computer controller, and a hydrogen generator. First, the coating of ∼ 3-cm long single mode fiber (SMF) was stripped by a fiberoptic stripper and fixed on two fiber holders after alcohol cleaning. Then the SMF was heated by a high temperature hydrogen flame and two stepper motors were controlled simultaneously. During the fabrication process, the stepper motor on the left was fixed and another stepper motor was controlled to pull the fiber. By adjusting the speed of the stepper motor and the flow of the hydrogen, a microfiber with different waist diameters can be obtained. Finally, the waist of the microfiber was tapered to a diameter of ∼ 10 μm and an interaction length of ∼ 1.2 cm, as shown in Fig. 1(b).

Fig. 1. (color online) (a) Experimental set up for fabricating the microfiber; (b) optical microscopic comparison image of standard fiber and microfiber.
2.2. Characterization of graphene

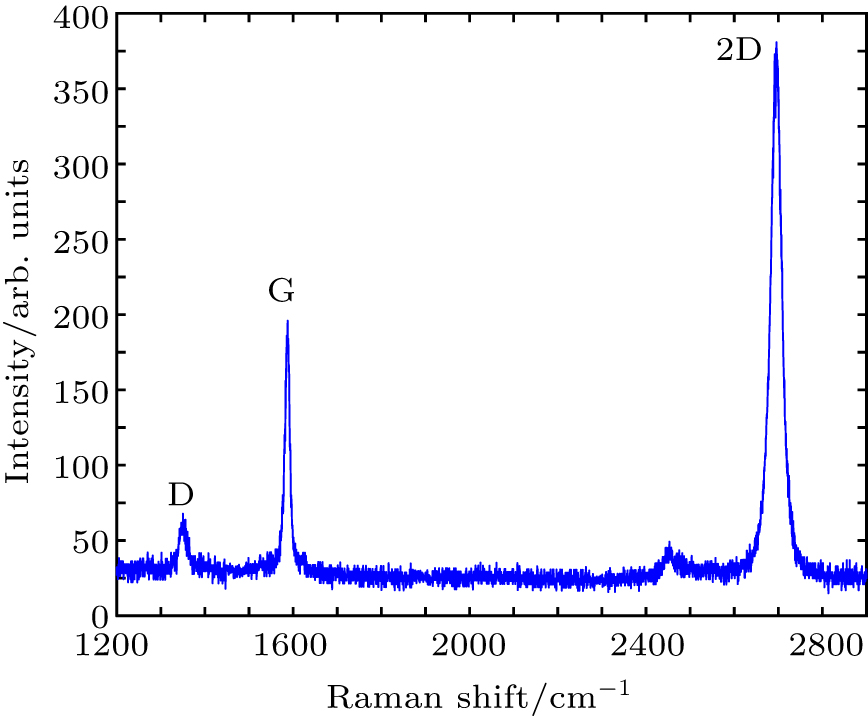
The graphene film used in the TDFL was directly grown by chemical vapor deposition (CVD) method on a copper substrate. Figure 2 shows the Raman spectrum of graphene with three typical Raman peaks from the characteristic curve. The three prominent peaks are located at approximately 1350.21 cm−1, 1587.48 cm−1, and 2696.12 cm−1, known as D, G, and 2D bands, respectively. The peak D band is associated with the stretching of the C–C bond with the sp3 electronic configuration of disordered graphite. The peak G band contributes to an E2g phonon of sp2 C atoms[25] and is located at the Brillouin zone center.[26] It was reported[27] that the intensity ratio of 2D and G peak (I2D/IG) could be used to estimate the number of grapheme layer, while the intensity of D peak could reveal the defect of graphene. In general, the 2D peak of single-layer graphene is 2–3 times as strong as the G peak. As observed from the Raman spectrum, the I2D/IG is calculated to be about 2.1, which indicates that a single layer of graphene is used in our experiment. The relatively weak D peak reveals little defects existing in the graphene samples.

Fig. 2. (color online) Raman spectrum of the monolayer graphene film.
2.3. Characterization of graphene

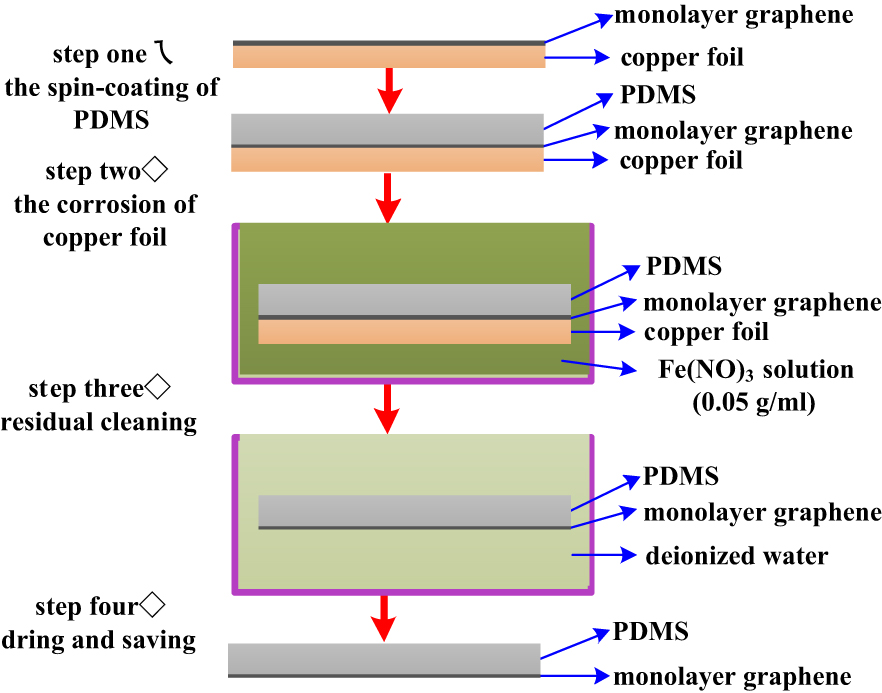
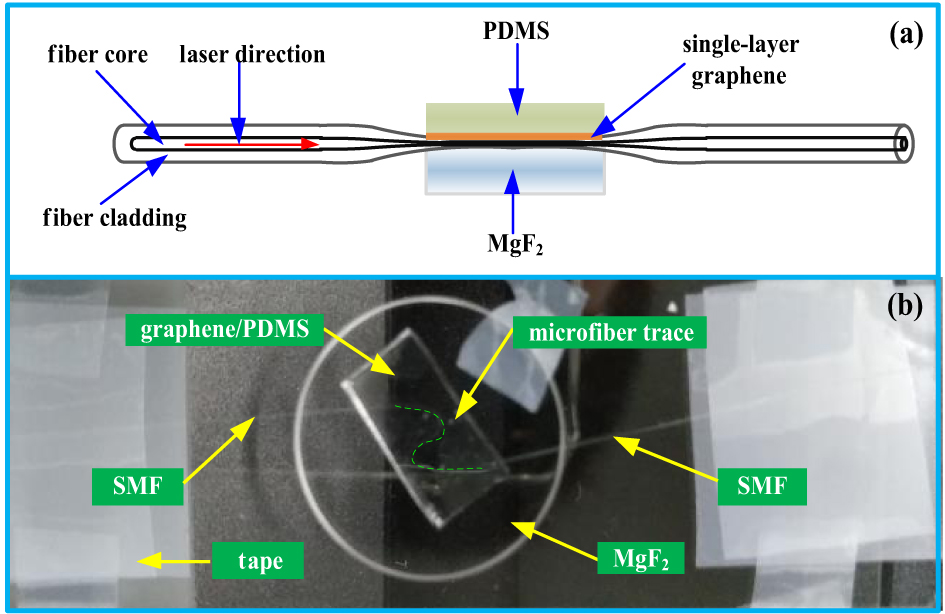
In order to reduce the contamination, a wetting transfer method was applied to transfer the monolayer graphene with a size of 1 cm × 0.5 cm from the copper substrate to PDMS film (∼ 1-mm thickness). The specific transfer process is shown in Fig. 3. Then, the fabricated graphene/PDMS film was covered on the upper surface of the microfiber, as shown in Fig. 4(a). In order to increase the interaction length of graphene, the waist is made into an S-shape on purpose, as depicted in Fig. 4(b), while the MgF2 substrate with low refractive index is used to ensure the evanescent wave propagation along the graphene film.

Fig. 3. (color online) The transfer of monolayer graphene.
Fig. 4. (color online) (a) Schematic diagram of the cross-section of GCM. (b) The corresponding photo of GCM.
2.4. The measurement of the modulation depth of GCM SA

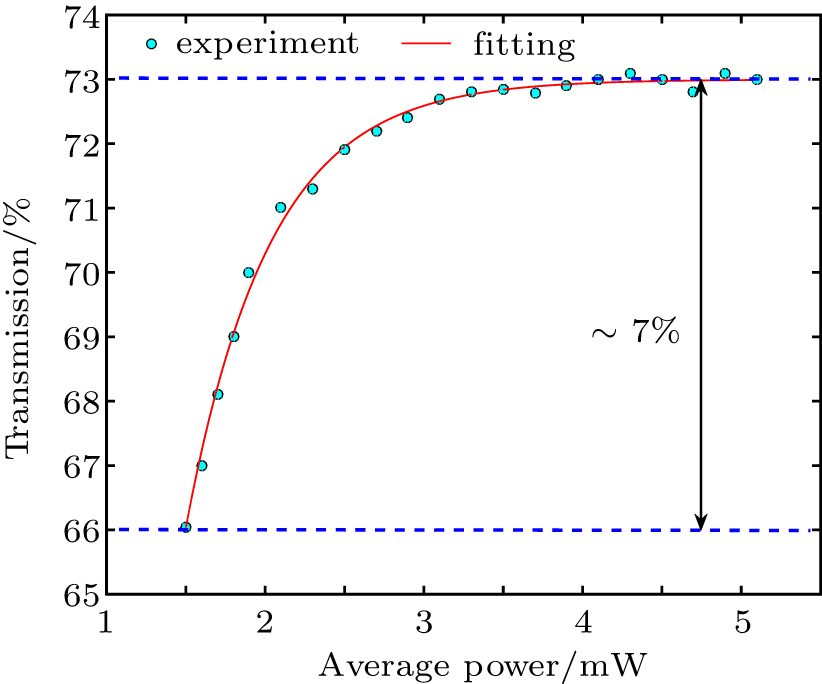
Figure 5 shows the SA properties of GCM, using a balanced twin-detector measurement technique. The laser source is a Tm/Ho-doped mode-locked fiber laser with a center wavelength of 1923.21 nm and a pulse width of 3.8 ps. A 60-dB attenuator was used to vary the input power during the experiment. A 3-dB coupler was used to separate the laser source into two beams equally. 50% of the laser was focused on the GCM and monitored by detector 1, and the other 50% of the laser as a reference beam was directly monitored by detector 2. By modifying the optical attenuator, the power of the incident laser on the GCM can be adjusted continuously. The nonlinear transmission can be measured by comparing the data of two detectors. Due to the difficulty of measurement of both the accurate optical power of the evanescent field and the effective mode area in the waist of the microfiber, we only provide the transmission curve versus the average power. Figure 6 shows the relation between the optical transmission and the average power of the input laser by using T(I) = 1 − ΔT · exp (−I/Isat) − Tns, where T(I) is transmission rate, ΔT is the modulation depth, I is the input intensity, Isat is the saturable intensity, and Tns is the non-saturable absorption loss. The fabricated GCM showed ∼ 7% modulation depth and ∼ 27% non-saturable loss.

Fig. 5. (color online) Schematic setup of the modulation depth measurement of GCM.
Fig. 6. (color online) Measured transmission data and the corresponding fitting curve of GCM.
3. Experimental setup

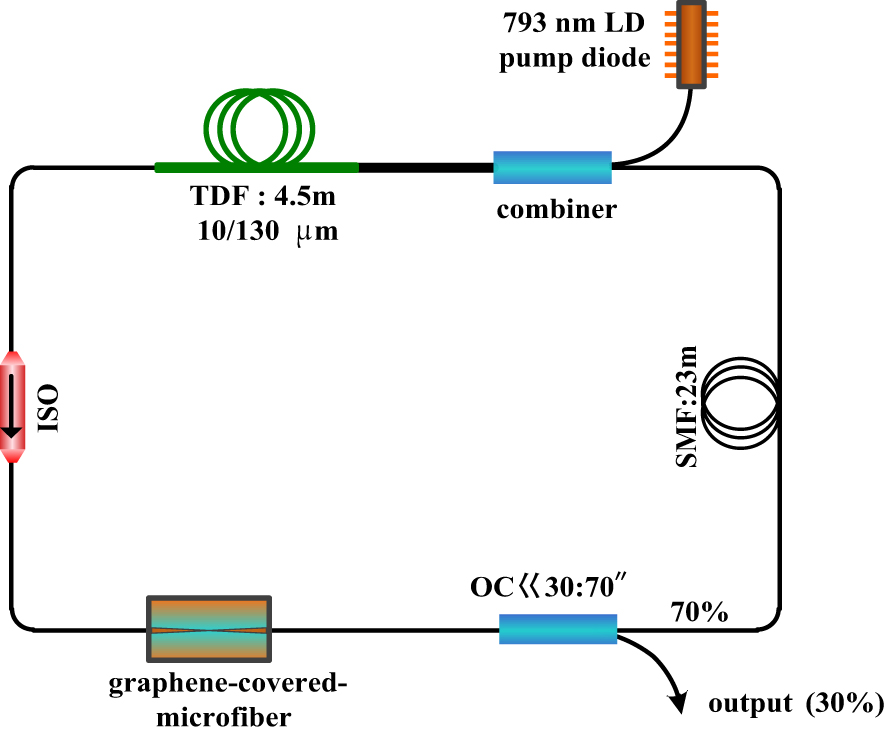
The experimental setup of the TDFL is sketched in Fig. 7. A simple ring cavity incorporates a 4.5-m long double clad TDF (IXF-2CF-Tm-O-10-130, IXFiber). A 793-nm laser diode (LD) with a maximum power of 12 W as a pump power is used to feed into the gain fiber via a (2 + 1) × 1 signal pump combiner. An optical isolator (ISO) is placed after the TDF to ensure unidirectional transmission of the ring cavity. The output of the laser is extracted from the 30% port of a 30:70 optical coupler (OC). In order to implement all-fiber cavity, an SA by covering graphene/PDMS onto thye microfiber is coupled into a ring cavity. All the components within the cavity are fusion-spliced, and the total length of the ring cavity is ∼ 29 m. Finally, the output characteristics of the laser is measured by a power meter (7Z01560, OPHIR), a 1-GHz digital sampling oscilloscope (WaveRunner 610Zi, Lecroy) with an InGaAs photodetector (ET-5000 F, EOT), an optical spectrum analyzer (AQ6375B, Yokogawa) with a resolution of 0.05 nm, and a spectrum analyzer (FSL3, Rohde & Schwarz) with 3-GHz bandwidth.

Fig. 7. (color online) Experimental setup of TDFL by using a GCM.
4. Results and discussion

First of all, we demonstrate the output characteristic of the TDFL without incorporating the graphene/PDMS film. By adjusting the pump power in a wide range, the laser can only work in CW state, which excludes the possibility of self-mode-locking and the mode-locking of nonlinear effect in the cavity. Then, a small sample of graphene (1 cm × 0.5 cm), which is cut from graphene/PDMS film, is covered on the waist of the microfiber. As the pump power increases from 1.25 W to 2.15 W, TDFL can be operated in five different lasing regimes around the threshold. These operating regimes include CW (1.25 W–1.44 W), CSML (1.44 W–1.55 W), MSML (1.55 W–1.85 W), a period of transition (1.85 W–2.02 W), and NLML (2.02 W–2.15 W). Each pulsed regime corresponding to a given pump power span is depicted in Fig. 8. Note that the low output power is mainly caused by unsatisfactory mode matching between the combiner and TDF.
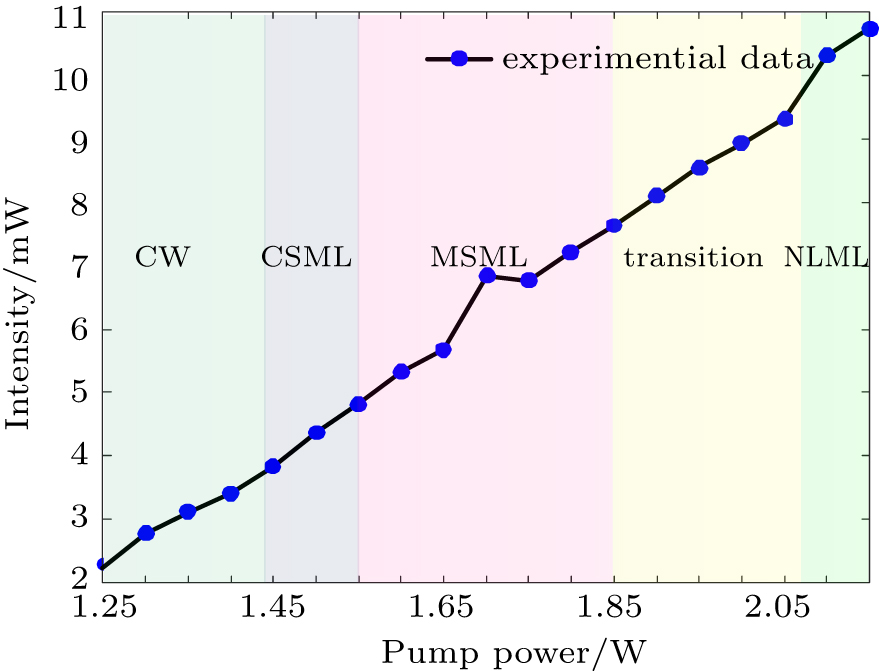
Fig. 8. (color online) Average output power as a function of the pump power (different colors represent different operating regimes).
4.1. CW and CSML operating

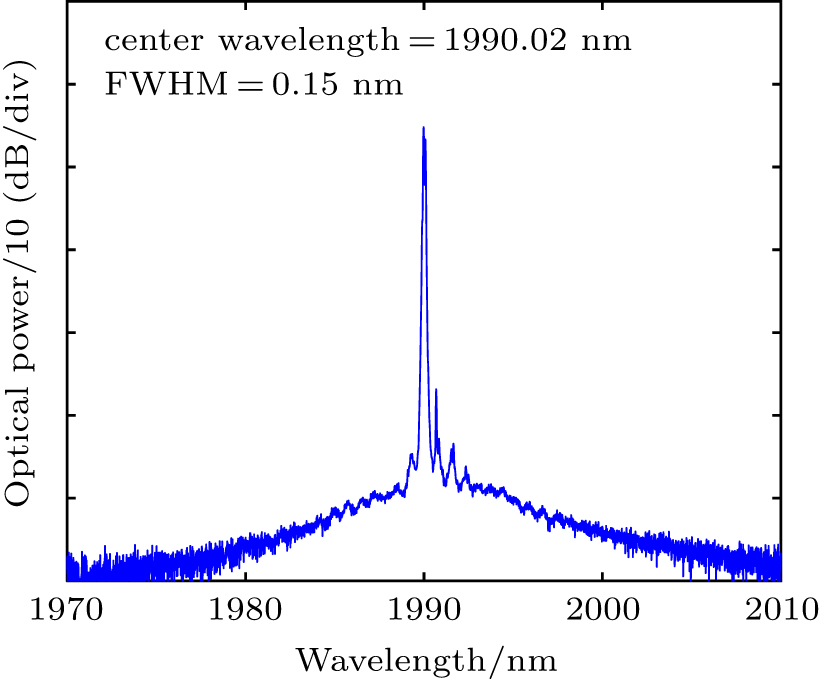
In the experiment, the fiber laser starts to operate in the CW state when the pump power is fixed at 1.25 W. The optical spectrum generated by the seed is shown in Fig. 9. It is centered at 1990.02 nm and has a full width at half maximum (FWHM) of 0.15 nm.

Fig. 9. (color online) Output spectrum of TDFL operated in CW state.

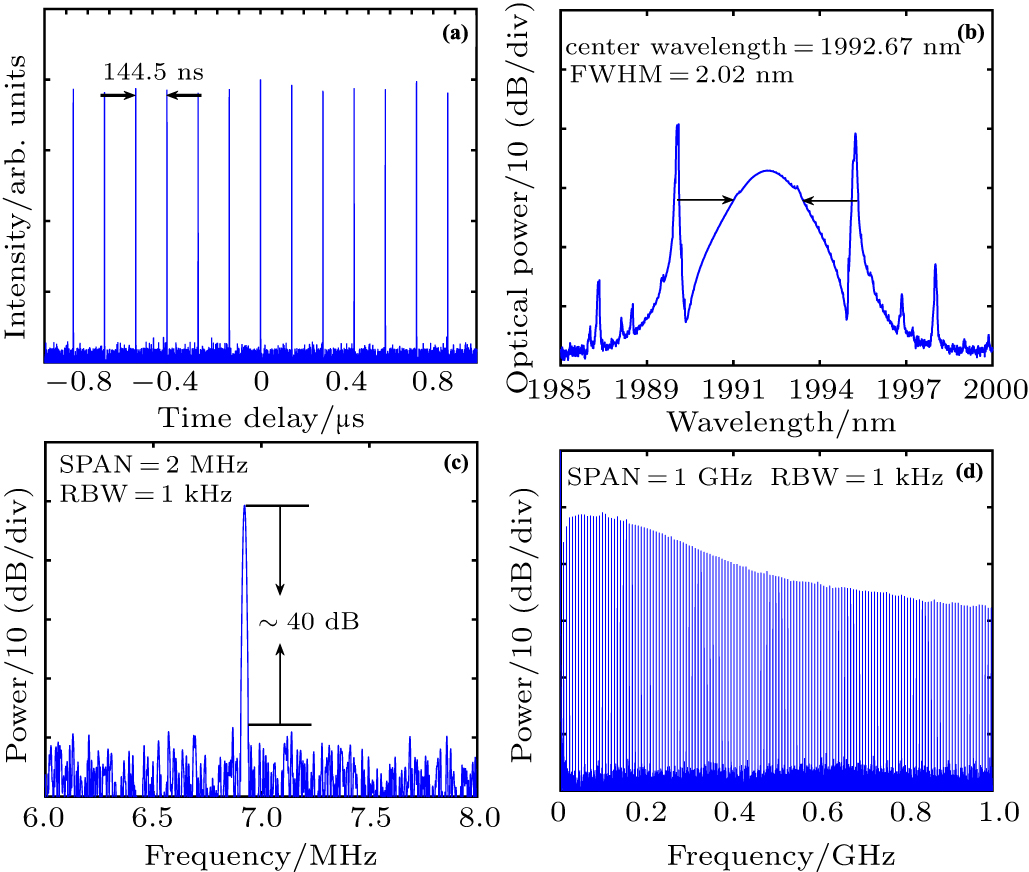
The self-starting CSML operation is achieved at the pumping power of 1.45 W when the pump power continues to increase. To optimize the mode-locked operation, the best performance is observed at a pump power of 1.50 W. Figure 10 shows the corresponding mode-locked oscilloscope trace, optical spectrum, and radio-frequency (RF) spectrum, respectively. Meanwhile, the laser pulse traces are measured using an oscilloscope with a high-speed photodetector, as shown in Fig. 10(a). The time interval between adjacent pulses is ∼ 144.5 ns. The blue line in Fig. 10(b) shows the typical mode-locking spectrum with a central wavelength of 1992.17 nm and a FWHM of 2.02 nm. Kelly sidebands of the spectrum are clearly observed, demonstrating that the TDFL is operated in the soliton regime. To investigate the stability of the laser, the RF spectrum of CSML has been measured with a resolution bandwidth (RBW) of 1 kHz, as presented in Fig. 10(c). The fundamental repetition rate of the laser is 6.92 MHz, corresponding to the cavity length of ∼ 29 m. In Figs. 10(c) and 10(d), the signal-to-noise ratio (SNR) of ∼ 40 dB at the fundamental repetition rate and flat wideband RF spectrum indicates good mode-locking stability and no Q-switching instabilities.[28,29] Limited to the laboratory conditions, the current self-correlation curves of the output pulse is estimated. Assuming that the pulses are operated in a transform-limited soliton form, the pulse-width of output laser is calculated to be ∼ 1.36 ps using the time-bandwidth product value 0.315, which is transform-limited hyperbolic secant pulses.[30]

Fig. 10. (color online) The output characteristics of the CSML in TDFL: (a) oscilloscope trace; (b) optical spectrum; (c) the fundamental RF spectrum with the resolution of 1 kHz and the span of 2 MHz; (d) wideband RF spectrum up to 1 GHz.
4.2. MSML operating

When the pump power exceeds 1.55 W, the stable CSML state is broken and the laser turns into the MSML state. In contrast to CSML, the MSML have two or more pulse sequences, but the period of the round-trip is constant. As the pumping increases from 1.55 W to 1.85 W, the operation states of 2 to 6 soliton pulses are obtained, under a pump power of 1.60 W, 1.64 W, 1.69 W, 1.75 W, and 1.83 W, respectively, as depicted in Fig. 11. Although these pulses are grouped together, they are separated from each other in time-domain. Meanwhile, all the multi-soliton pulses have exactly similar pulse quality at the same pump power. Due to the sensitivity of the photodetector and the accuracy of the oscilloscope, there is a slight difference between the pulses. In order to further explore the difference between the MSML and CSML, we also observe the corresponding optical spectrum. As can be seen, the spectrum of MSML shows an obvious CW component relative to CSML.
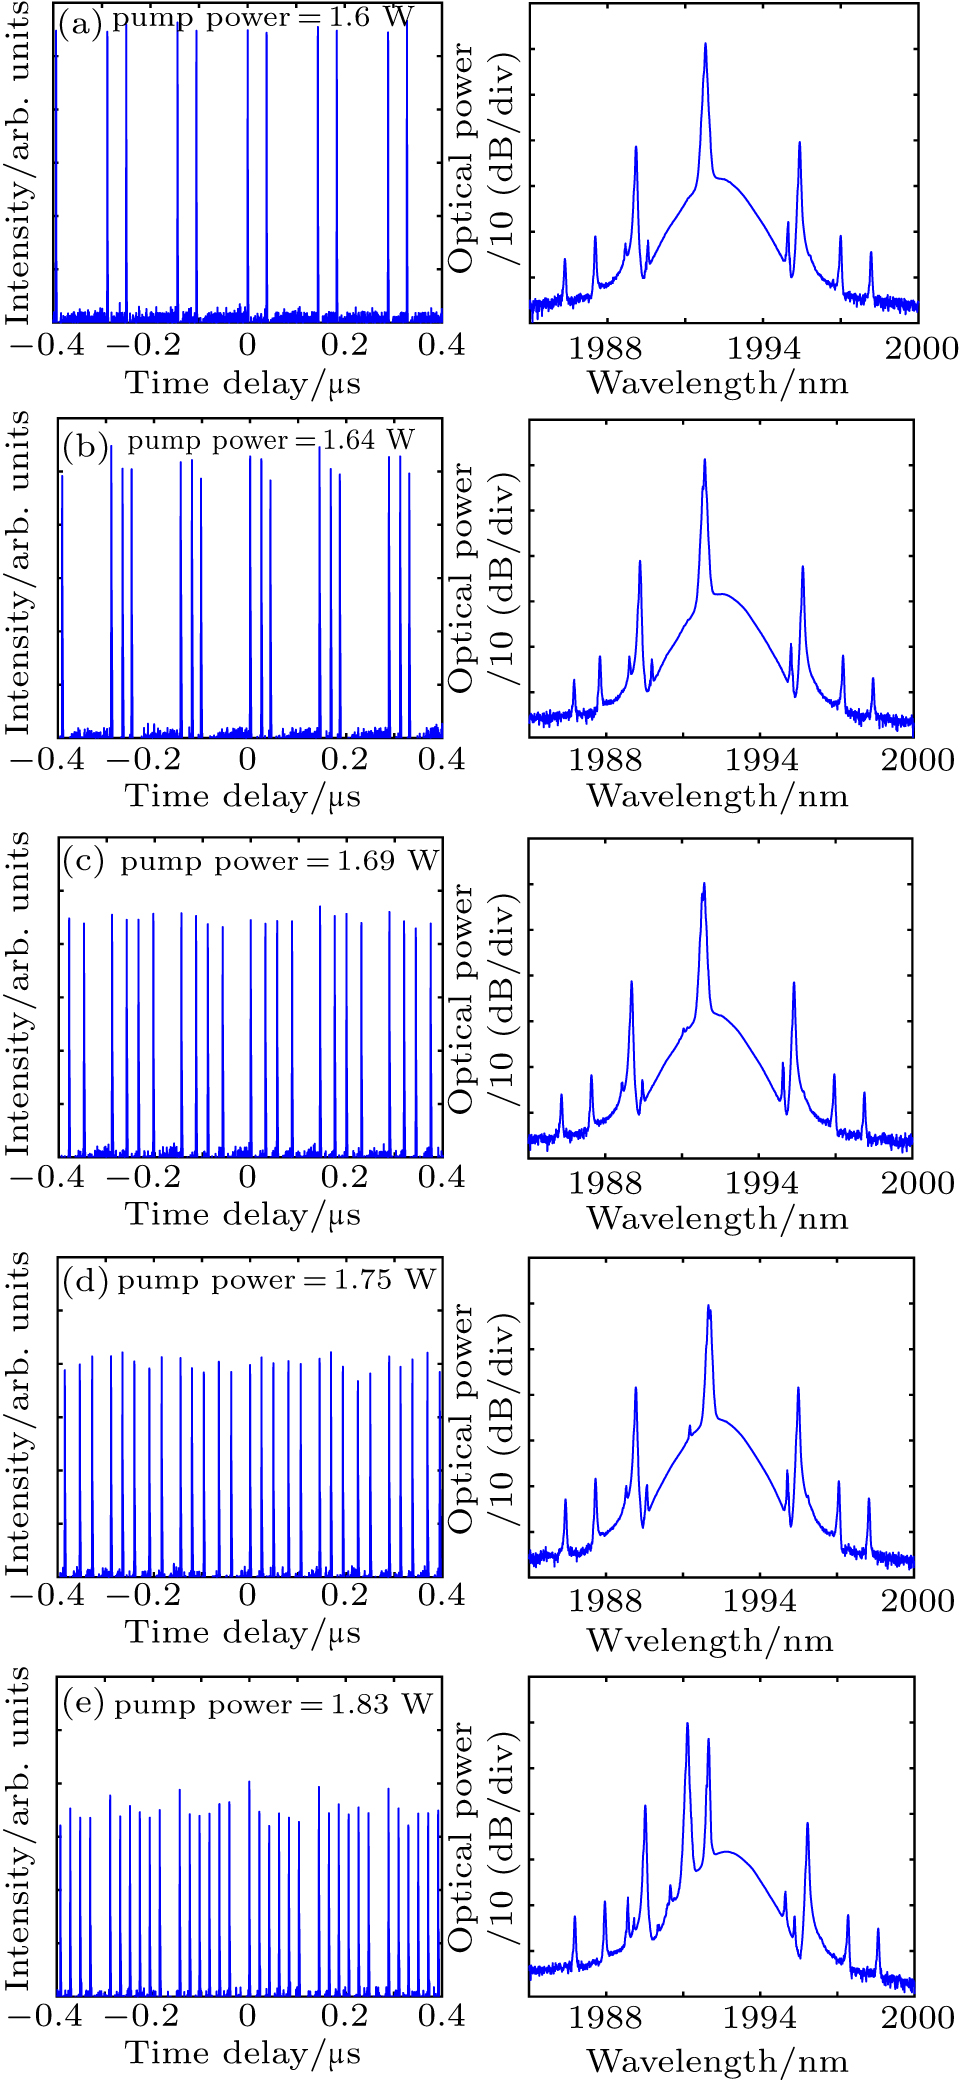
Fig. 11. (color online) The characteristics of mode-locked TDFL: (a)–(e) pulse sequences under different conditions of the pump power (left) and the corresponding optical spectrum (right).

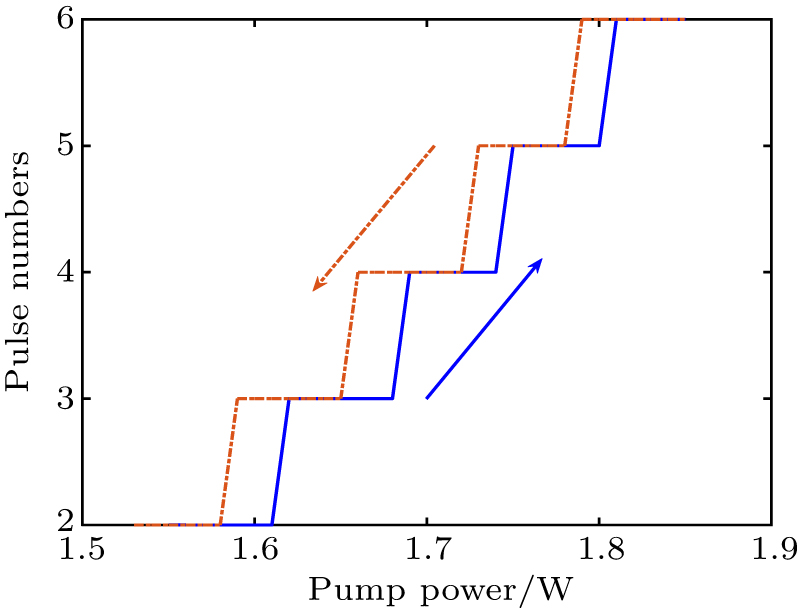
In addition, mode-locking operation is still maintained by slightly decreasing the pump power to a relatively low value, generally known as pump hysteresis. For the MSML operation, the generation and annihilation of new soliton pulses also show the pump hysteresis, as shown in Fig. 12. When multi-soliton pulses already exist in the laser cavity, the pump power is slowly increased and new soliton pulses are generated one by one. On the contrary, the pump power is slowly reduced and the existing soliton pulses will annihilate one by one. The laser will remain in the mode-locking state as long as there is a soliton in the cavity. In the experiment, with the increase of the pump power (1.55 W–1.85 W), the 2–6 order multi-soliton pulse corresponding to a pump power ranges from 1.55 W–1.61 W (2 solitons), 1.62 W–1.68 W (3 solitons), 1.69 W–1.74 W (4 solitons), 1.75 W–1.80 W (5 solitons), and 1.81 W–1.85 W (6 solitons), while carefully decreasing the pump strength (1.85 W–1.53 W), the pump power range obtained is 1.79 W–1.85 W (6 solitons), 1.73 W–1.78 W (5 solitons), 1.66 W–1.72 W (4 solitons), 1.59 W–1.65 W (3 solitons), and 1.53 W–1.58 W (2 solitons).

Fig. 12. (color online) Hysteresis phenomenon of the MSML pulses numbers versus the pump power.
4.3. Transition from MSML to NLML

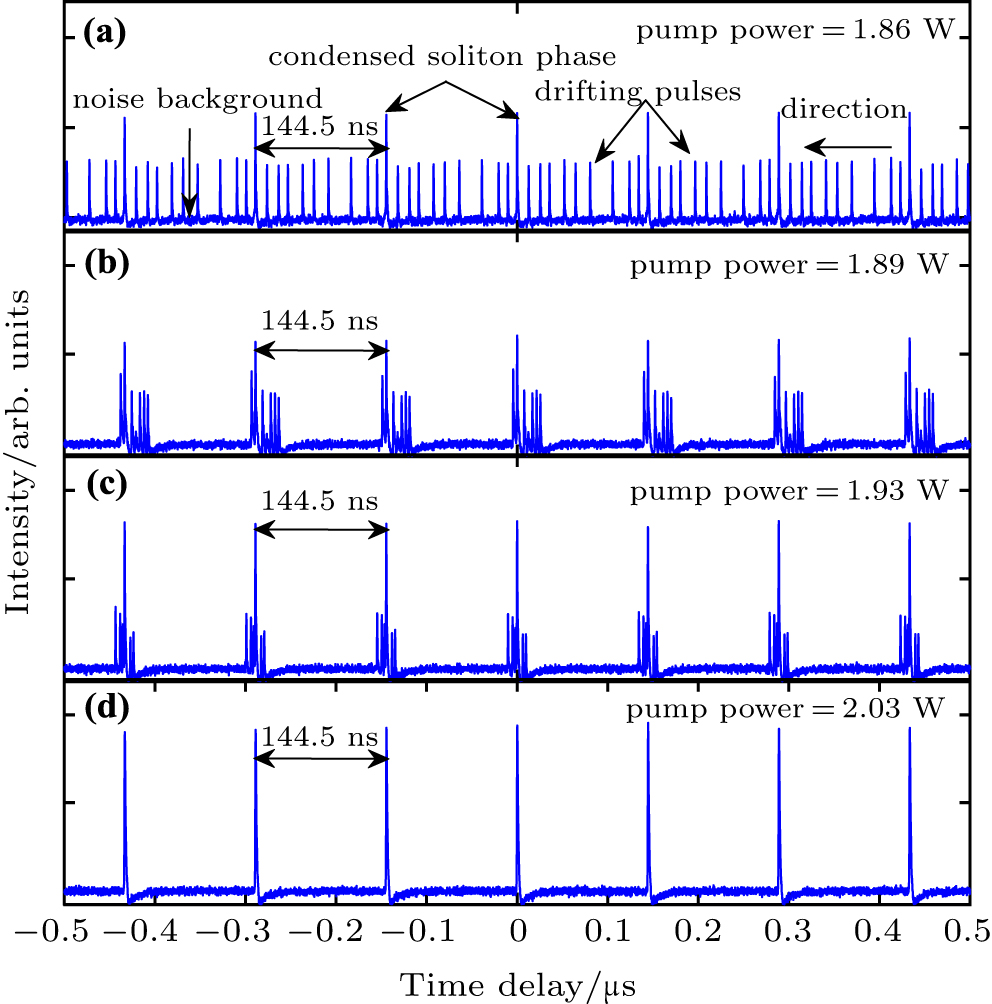
Under the 6-solitons mode-locked operation, the pump power is further increased to 1.86 W. An interesting phenomenon, namely the soliton rain consisting of noise background, drifting pulses, and condensed soliton phase, has been observed, as shown in Fig. 13(a). In recent years, the soliton rain has been found in the 1-μm band of ytterbium-doped fiber laser (YDFL) and the 1.5-μm band erbium-doped fiber laser (EDFL).[31] In contrast to the preceding MSML pulses, the soliton rain regime is not only increasing the number of pulses, but also accompanied by the increase of the intensity of the condensed soliton phase. The remaining pulses present a tendency to flow slowly from right to left. Next, by increasing the pump power from 1.86 W to 2.02 W, these drifting pulses can be moved faster and event gather together, forming an NLML in the cavity, as shown in Fig. 13(d).

Fig. 13. (color online) The evolution of the soliton rain to NLML.

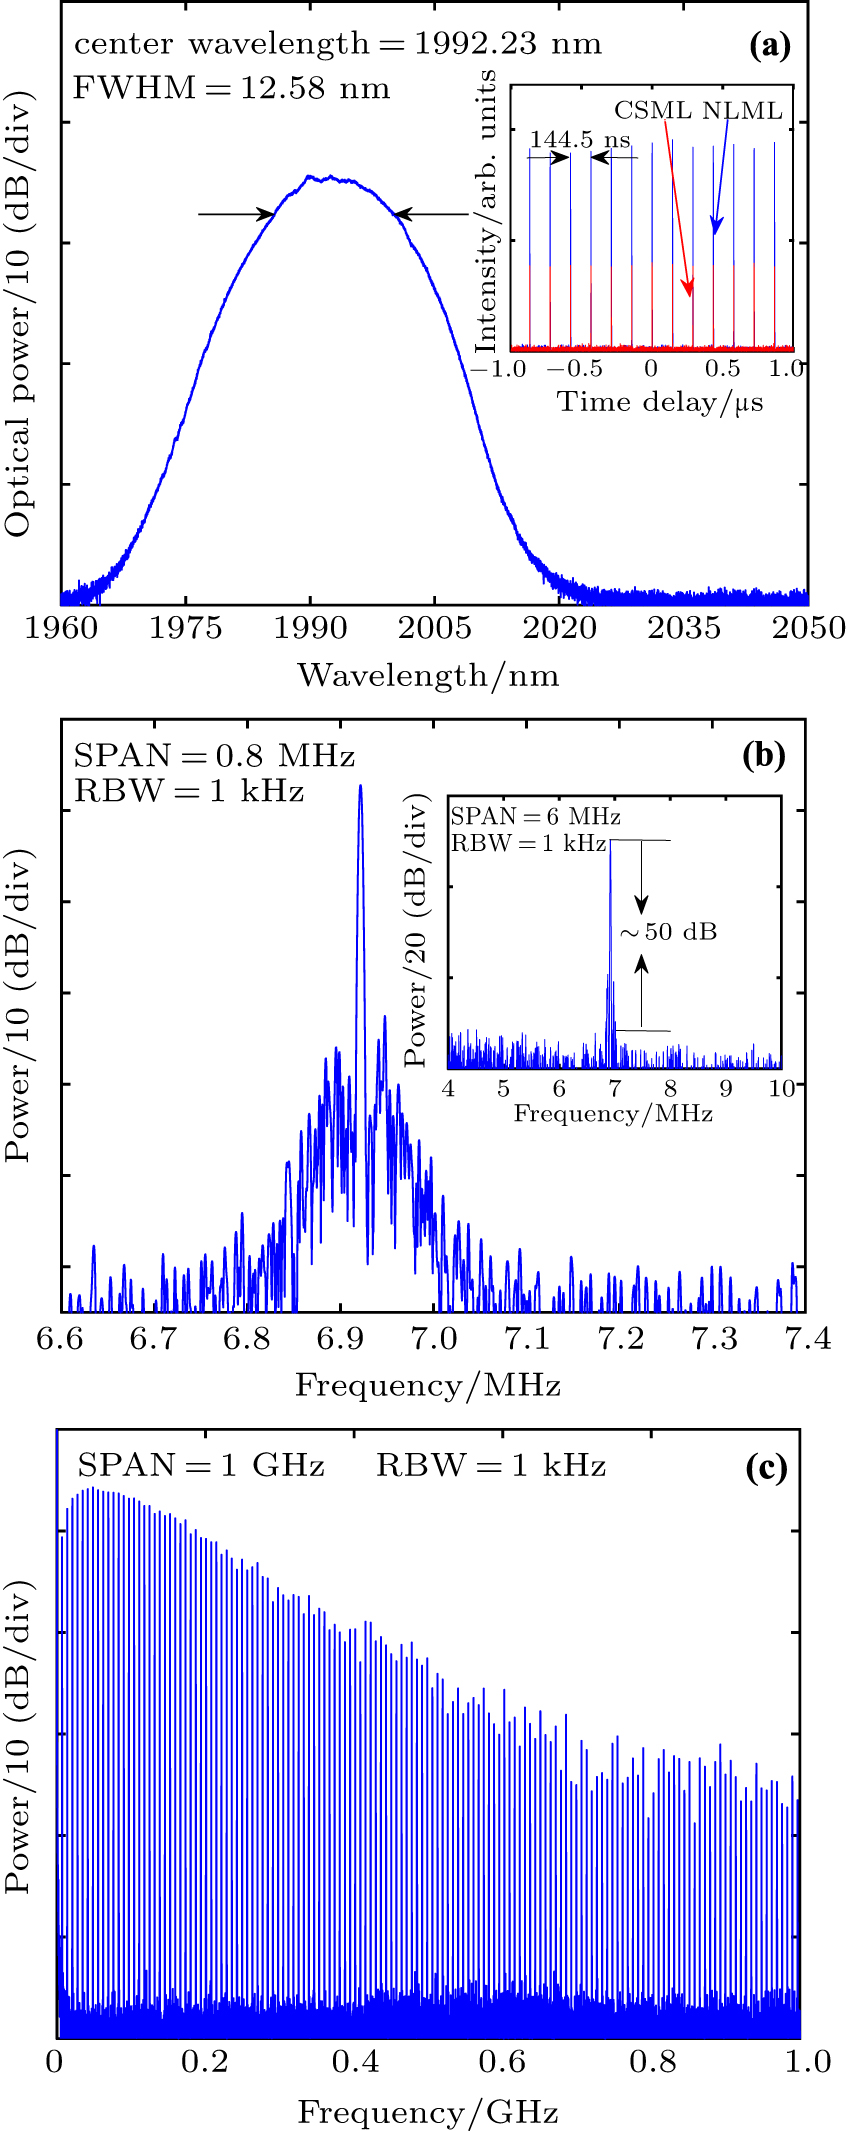
In order to illustrate the difference between CSML and NLML, figure 14 gives the output characteristics of NLML, including oscilloscope trace, optical spectrum, the fundamental RF spectrum, and wideband RF spectrum under a pump power of 2.03 W. It is clear that NLML shows a stronger pulse intensity (almost twice of CSML) and a higher SNR of ∼ 50 dB. Note that NLML presents a smooth optical spectrum with a center wavelength of 1992.23 nm and an FWHM of ∼ 12.58 nm. In addition, obvious shoulder and fluctuations of high-order harmonics are exhibited on the fundamental RF spectrum and wideband RF spectrum, respectively. These characteristics also indicate that the output pulse is noise-like at the pump power of 2.03 W, similar to the previously reported pulsed laser.[32,33]

Fig. 14. (color online) The characteristics of the NLML in TDFL: (a) optical spectrum (inset is the comparison of oscilloscope trace between CSML and NLML); (b) the fundamental RF spectrum with the resolution of 1 kHz and the span of 0.8 MHz (inset is the fundamental RF spectrum with the span of 6 MHz); (c) wideband RF spectrum up to 1 GHz.
4.4. Discussion

In this paper, by covering a graphene/PDMS film on the microfiber as an SA, an all-fiber thulium-doped fiber system with five different output characteristics that can be adjusted by increasing the pump power is presented. Firstly, the laser operates in the CW state and soon enters CSML as the pump power increases. When the pump power exceeds 1.55 W, the laser is converted from CSML pulse to MSML pulse with the same energy in the steady state. This phenomenon can be found in all kinds of mode-locked lasers, such as NALM mode-locked laser, NPR mode-locked laser, and other real SA mode-locked laser. That is, it is a common feature of the laser and has nothing to do with mode-locking. The generation of MSML pulses can be attributed to the peak power clamping effect.[34] In general, the soliton energy is related to the cavity structure of the laser. Under the constant cavity parameters, the maximum energy contained by the soliton will be determined. If the SA effect in the cavity is strong enough, increasing the pump power will only cause the formation of MSML pulses at a certain threshold. At the same time, due to the soliton energy quantization effect,[30,31,35,36] the weak soliton pulse becomes stronger by the positive feedback, and the strong soliton behaves oppositely and is weakened. In the end, all pulses reach a steady state with the same peak power.

Meanwhile, the pump hysteresis effect is also found in the process of the MSML. In the past reports,[37,38] Komarov et al.[38] have made an intensive study on the pump hysteresis of passively mode-locked fiber lasers. According to their research, the pump hysteresis stems from the competition between the positive feedback from the nonlinear transmittance of the SA and the negative feedback related to the modulation effect of the pulsed phase modulation. And the generation and annihilation of solitons must go through a continuous increase or decrease of the pump power, which is consistent with our experiment. In addition, there is obvious jitter in switching between adjacent pulses of multi-soliton mode-locking in the experiment. It is necessary to increase or decrease a certain amount of power to stabilize the current state. Hence, when drawing the graph of hysteresis, the switching between adjacent pulses of multi-soliton mode-locking is based on the current stable value. When the pump power is between 1.85 W and 2.02 W, the output pulse shows the evolution of soliton rain to NLML. Compared with CSML, higher pulse energy, larger FWHM, smooth spectrum, and obvious fluctuation of wideband RF are important characteristics of laser operation in a NLML regime.[32,33]

5. Conclusions

In summary, we have demonstrated an all-fiberized TDFL by using a GCM in the 2-μm region. With the increase of the pump power, phenomena of multiple operation states, mainly including CW, CSML and MSML, a period of transition and NLML, are obtained in the experiment. To the best of our knowledge, this is the first successful application of GCM SA in multiple operation states operating at 2-μm region. This work suggests that the GCM SA is potentially useful for mode-locked pulse laser operations in the eye-safe region. And the operation switchable characteristic can provide a new way to deal with increasingly complex application requirements.

Reference
[1] Wang Q Geng J Luo T Jiang S 2009 Opt. Lett. 34 3616
[2] Yan Z Y Li X H Tang Y L Shum P P Yu X Zhang Y Wang Q J 2015 Opt. Express 23 4369
[3] Jin X X Wang X Wang X L Zhou P 2015 Appl. Opt. 54 8260
[4] Sobon G Sotor J Pasternak I Krajewska A Strupinski W Abramski K M 2015 Opt. Express 23 9339
[5] Boguslawski J Sotor J Sobon G Kozinski R Librant K Aksienionek M Lipinska L Abramski K M 2015 Photon. Res. 3 119
[6] Sotor J Sobon G Pasternak I Krajewska A Strupinski W Abramski K M 2013 Opt. Express 21 18994
[7] Sobon G Sotor J Pasternak I Krajewska A Strupinski W Abramski K M 2013 Opt. Express 21 12797
[8] Jiang K Wu Z C Fu S N Song J Li H Z Tang M Shum P Liu D M 2016 IEEE Photon. Technol. Lett. 28 2019
[9] Wang X F Peng X L Jiang Q X Gu X H Zhang J H Mao X F Yuan S Z 2017 Chin. Phys. 26 114205
[10] Jung M Lee J Koo J Park J Song Y W Lee K Lee S Lee J H 2014 Opt. Express 22 7865
[11] Sotor J Sobon G Kowalczyk M Macherzynski W Paletko P Abramski K M 2015 Opt. Lett. 40 3885
[12] Luo Z Q Li Y Y Huang Y Z 2016 Opt. Eng. 55 081310
[13] Fu B Hua Y Xiao X S Zhu H W Sun Z P Yang C X 2014 IEEE J. Sel. Top. Quantum Electron. 20 1100705
[14] Sobon G Sotor J Pasternak I Krajewska A Strupinski W Abramski K M 2015 Opt. Mater. Express 5 2884
[15] Yang G Liu Y G Wang Z Lou J C Wang Z H Liu Z B 2016 Laser Phys. Lett. 13 065105
[16] Wang Y Ni W J Set S Y Yamashita S 2017 IEEE Photon. Technol. Lett. 29 913
[17] Li X H Yu X C Yan Z Y Wang Q J Yu X Zhang Y 2015 Proc. IEEE Conf. Lasers Electro–Optics May 10–15, 2015 San Jose, USA 1 10.1364/cleo_si.2015.sm3p.3
[18] Jung M Koo J Debnath P Song Y W Lee J H 2012 Appl. Phys. Express 5 112702
[19] Jeong H Choi S Y Kim M H Rotermund F Cha Y H Jeong D Y Lee S B Lee K Yeom D I 2016 Opt. Express 24 14152
[20] Wang Q Q Chen T Zhang B T Li M S Lu Y F Chen K P 2013 Appl. Phys. Lett. 102 131117
[21] Ahmad H Faruki M J Razak M Z A Tiu Z C Ismail M F 2017 Opt. Laser Technol. 88 166
[22] Sheng Q W Feng M Xin W Han T Y Liu Y G Liu Z B Tian J G 2013 Opt. Express 21 14859
[23] Mouchel P Semaan G Niang A Salhi M Flohic M L Sanchez F 2017 Appl. Phys. Lett. 111 031106
[24] Liu Z B Feng M Jiang W S Xin W Wang P Sheng Q W Liu Y G Zhou W Y Tian J G 2013 Laser Phys. Lett. 10 065901
[25] Ferrari A C Robertson J 2000 Phys. Rev. 61 14095
[26] Pimenta M A Dresselhaus G Dresselhaus M S Cancado L G Jorio A Saito R 2007 Phys. Chem. Chem. Phys. 9 1276
[27] Graf D Molitor F Ensslin K Stampfer C Jungen A Hierold C Wirtz L 2007 Nano Lett. 7 238
[28] Liu X M Han D D Sun Z P Zeng C Lu H Mao D Cui Y D Wang F Q 2013 Sci. Rep. 3 2718
[29] Liu X M Cui Y D Han D D Yao X K Sun Z P 2015 Sci. Rep. 5 9101
[30] Jung M Koo J Park J Song Y M Jhon Y M Lee K Lee S Lee J H 2013 Opt. Express 21 20062
[31] Liu M Luo A P Zheng X W zhao N Liu H Luo Z C Xu W C Chen Y Zhao C J Zhang H 2015 J. Lightwave Technol. 33 2056
[32] Wang J Z Liang X Y Hu G H Zheng Z J Lin S H Ouyang D Wu X Yan P G Ruan S C Sun Z P Hasan T 2016 Sci. Rep. 6 28885
[33] Zheng X W Luo Z C Liu H Zhao N Ning Q Y Liu M Feng X H Xing X B Luo A P Xu W C 2014 Appl. Phys. Express 7 042701
[34] Tang D Y Zhao L M Zhao B Liu A Q 2005 Phys. Rev. A 72 043186
[35] Zhang H Tang D Y Wu X Zhao L M 2009 Opt. Express 17 12692
[36] Grudinin A B Richardson D J Payne D N 1992 Electron. Lett. 28 67
[37] Liu X M 2010 Phys. Rev. 81 023811
[38] Komarov A Leblond H Sanchez F 2005 Phys. Rev. 71 362