


Electrical and thermal characterization of near-surface electrical discharge plasma actuation driven by radio frequency voltage at low pressure
Cite this Article
Yang Zhen, Song Hui-Min, Jin Di, Jia Min, Wang Kang. Electrical and thermal characterization of near-surface electrical discharge plasma actuation driven by radio frequency voltage at low pressure. Chinese Physics B, 2018, 27(8): 085205 
Permissions
Electrical and thermal characterization of near-surface electrical discharge plasma actuation driven by radio frequency voltage at low pressure
† Corresponding author. E-mail:
Project supported by the National Natural Science Foundation of China (Grant Nos. 11472306, 51407197, and 51507187).
Abstract
The electrical and thermal characterization of near-surface electrical discharge plasma driven by radio frequency voltage are investigated experimentally in this paper. The influences of operating pressure, electrode distance, and duty cycle on the discharge are studied. When pressure reaches 60 Torr (1 Torr = 1.33322 × 10² Pa) the transition from diffuse glow mode to constricted mode occurs. With the operating pressure varying from 10 Torr to 60 Torr, the discharge energy calculated from the charge–voltage (Q–V) Lissajous figure decreases rapidly, while it remains unchanged between 60 Torr and 460 Torr. Under certain experimental conditions, there exists an optimized electrode distance (8 mm). As the duty cycle of applied voltage increases, the voltage–current waveforms and Q–V Lissajous figures show no distinct changes.
Keyword:radio frequency discharge;charge-voltage Lissajous figure;temperature distribution;plasma actuation
1. Introduction
As a novel kind of plasma aerodynamic actuation, radio frequency discharge has received increasing attention in recent years. Compared with other types of plasma discharges, radio frequency discharge has several advantages, such as better stability in high-speed air flows, higher heating efficiency, and simpler power tuning.[1–3] Leonov et al. found that when static pressure stays below 100 Torr the discharge mode of single-electrode radio frequency plasma is glow discharge, and as static pressure increases filamentary discharge could be observed.[4,5] Klimov et al. designed the surface HF plasma actuator, which is driven by 0.5-MHz high frequency AC power and 3-kV DC power. In a flow of Mach 0.4, the generated plasma consists of many filaments, and its highest gas temperature reaches about 2000 K measured by optical spectroscopy.[6] Dedrick et al. studied plasma propagation of surface radio frequency dielectric barrier discharge under atmospheric pressure, and the frequency was set to be 13.56 MHz. Results showed that under a lower input power, the discharge channels were not equally distributed but seemed branchlike. With the increase of input power, the distribution gradually became more uniform and the plasma channels extended further. The relationship between plasma propagation and voltage waveform was also analyzed.[7,8]
At present the measurement methods of gas discharge plasma temperature mainly include infrared thermal imager, spectroscopy, and thermocouples. Carlo et al. investigated the effects of actuator geometries, dielectric materials, and supply voltage on the dielectric barrier discharge (DBD) temperature. It was found that the rotational temperature obtained by spectroscopic measurements hardly changed, which is the same as the gas temperature measured by thermography.[9] Dong et al. evaluated the plasma temperature through spectroscopy emission at a working voltage of 8 kV and discharge frequency of 2 kHz, and the temperature rose by 40 K.[10] Joussot et al. investigated the thermal characteristics of DC glow discharge in a Mach 2 air flow. Experimental results showed that the surface temperature increased with the increase of current.[11] Rakshit et al. revealed the mechanism of dielectric surface heat transfer at several kHz. The correlation between discharge cycle and temperature distribution was analyzed experimentally, and the heat was mainly transferred from the hot air flow into the dielectric through convection.[12] Wang et al. measured the temperature distribution of the radio frequency DBD with an infrared thermal imager, and the influences of duty cycle, frequency, and other discharge parameters on the dielectric temperature were also analyzed.[13] The studies mentioned above mainly focus on DBD discharge, in which the discharge power is not well concentrated, and the shock control ability is quite limited, as found in the experiment.[14] With this motivation a plasma actuator with pinlike electrodes is adopted in this paper, which is believed to be promising in power concentration and subsequently enhancing the effect of shock wave control.
Low pressure is a typical environment for aircraft, which has great influences on the plasma characteristics and flow control effect.[15,16] Liu et al. found that a transition between the striated and non-striated modes for capacitively coupled radio frequency CF4 plasmas can be observed by changing the pressure.[17] Therefore, the influences of operating pressure, as well as electrode distance, and duty cycle on the electrical and thermal characteristics of radio frequency discharge are investigated experimentally.
2. Experimental setup
Figure
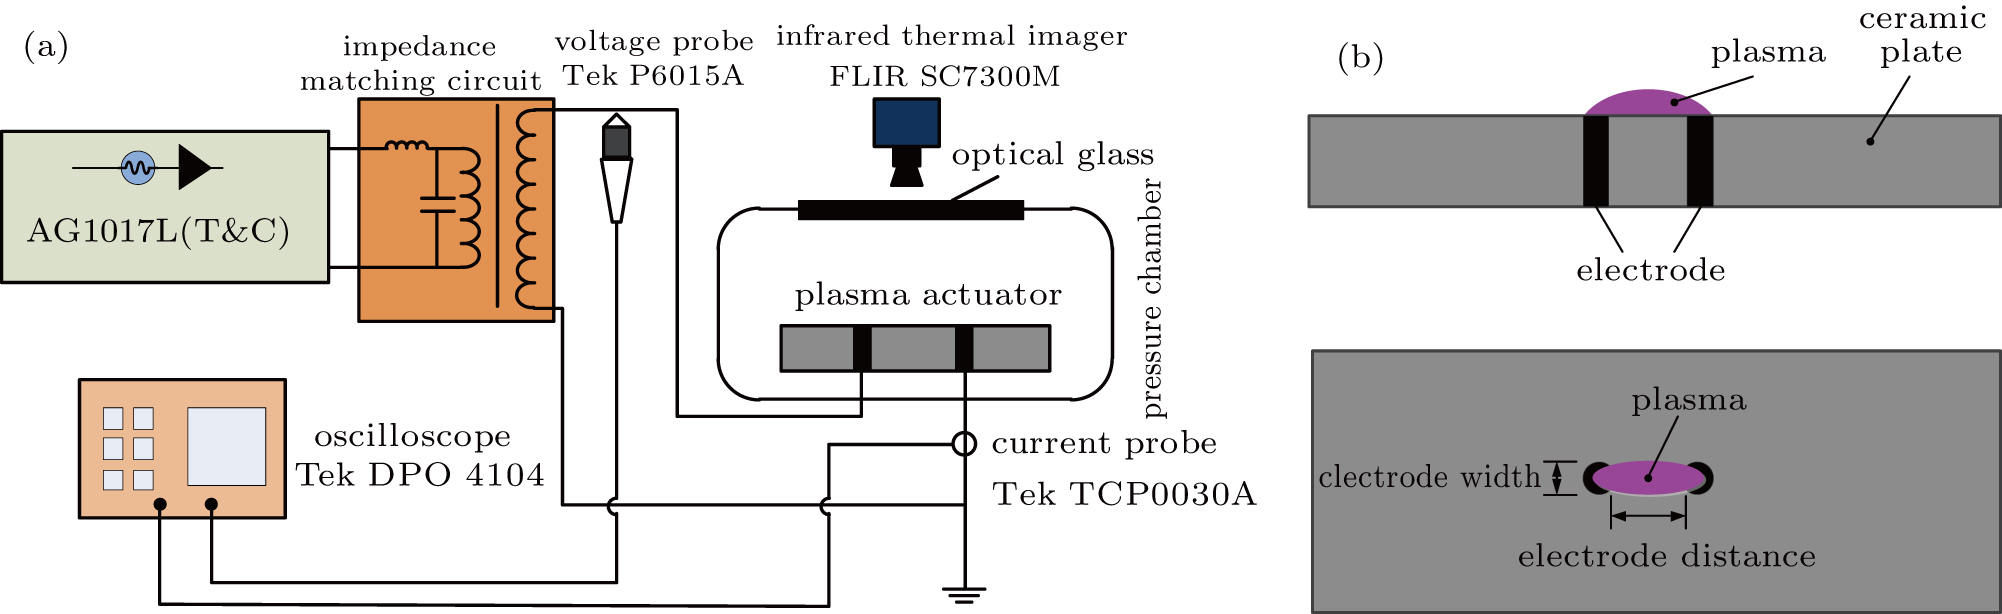 | Fig. 1. (color online) Schematic diagrams of the experimental setup and plasma actuator. |
The digital oscilloscope (Tektronix DPO4104) together with a high voltage probe (Tektronix P6015 A) and a current probe (Tektronix TCP0030 A) are used to collect and store the voltagecurrent plots. The surface temperature measurements are carried out using an FLIR SC7300M Infrared Thermal Imager with a spectral range of 3.7 μm–4.8 μm and an MCT IR photo-detector composed of a 320 × 240-pixel array. The temperature between −20 °C and 1500 °C could be measured.
3. Results and discussion
3.1. Electrical characteristics
The influences of operating pressure, electrode distance, and duty cycle on the voltagecurrent waveforms and discharge mode are investigated experimentally, and the relationship between the energy per cycle and the impedance magnitude is discussed based on Q–V Lissajous figures.
3.1.1. Influence of operating pressure on electrical characteristics
Figure
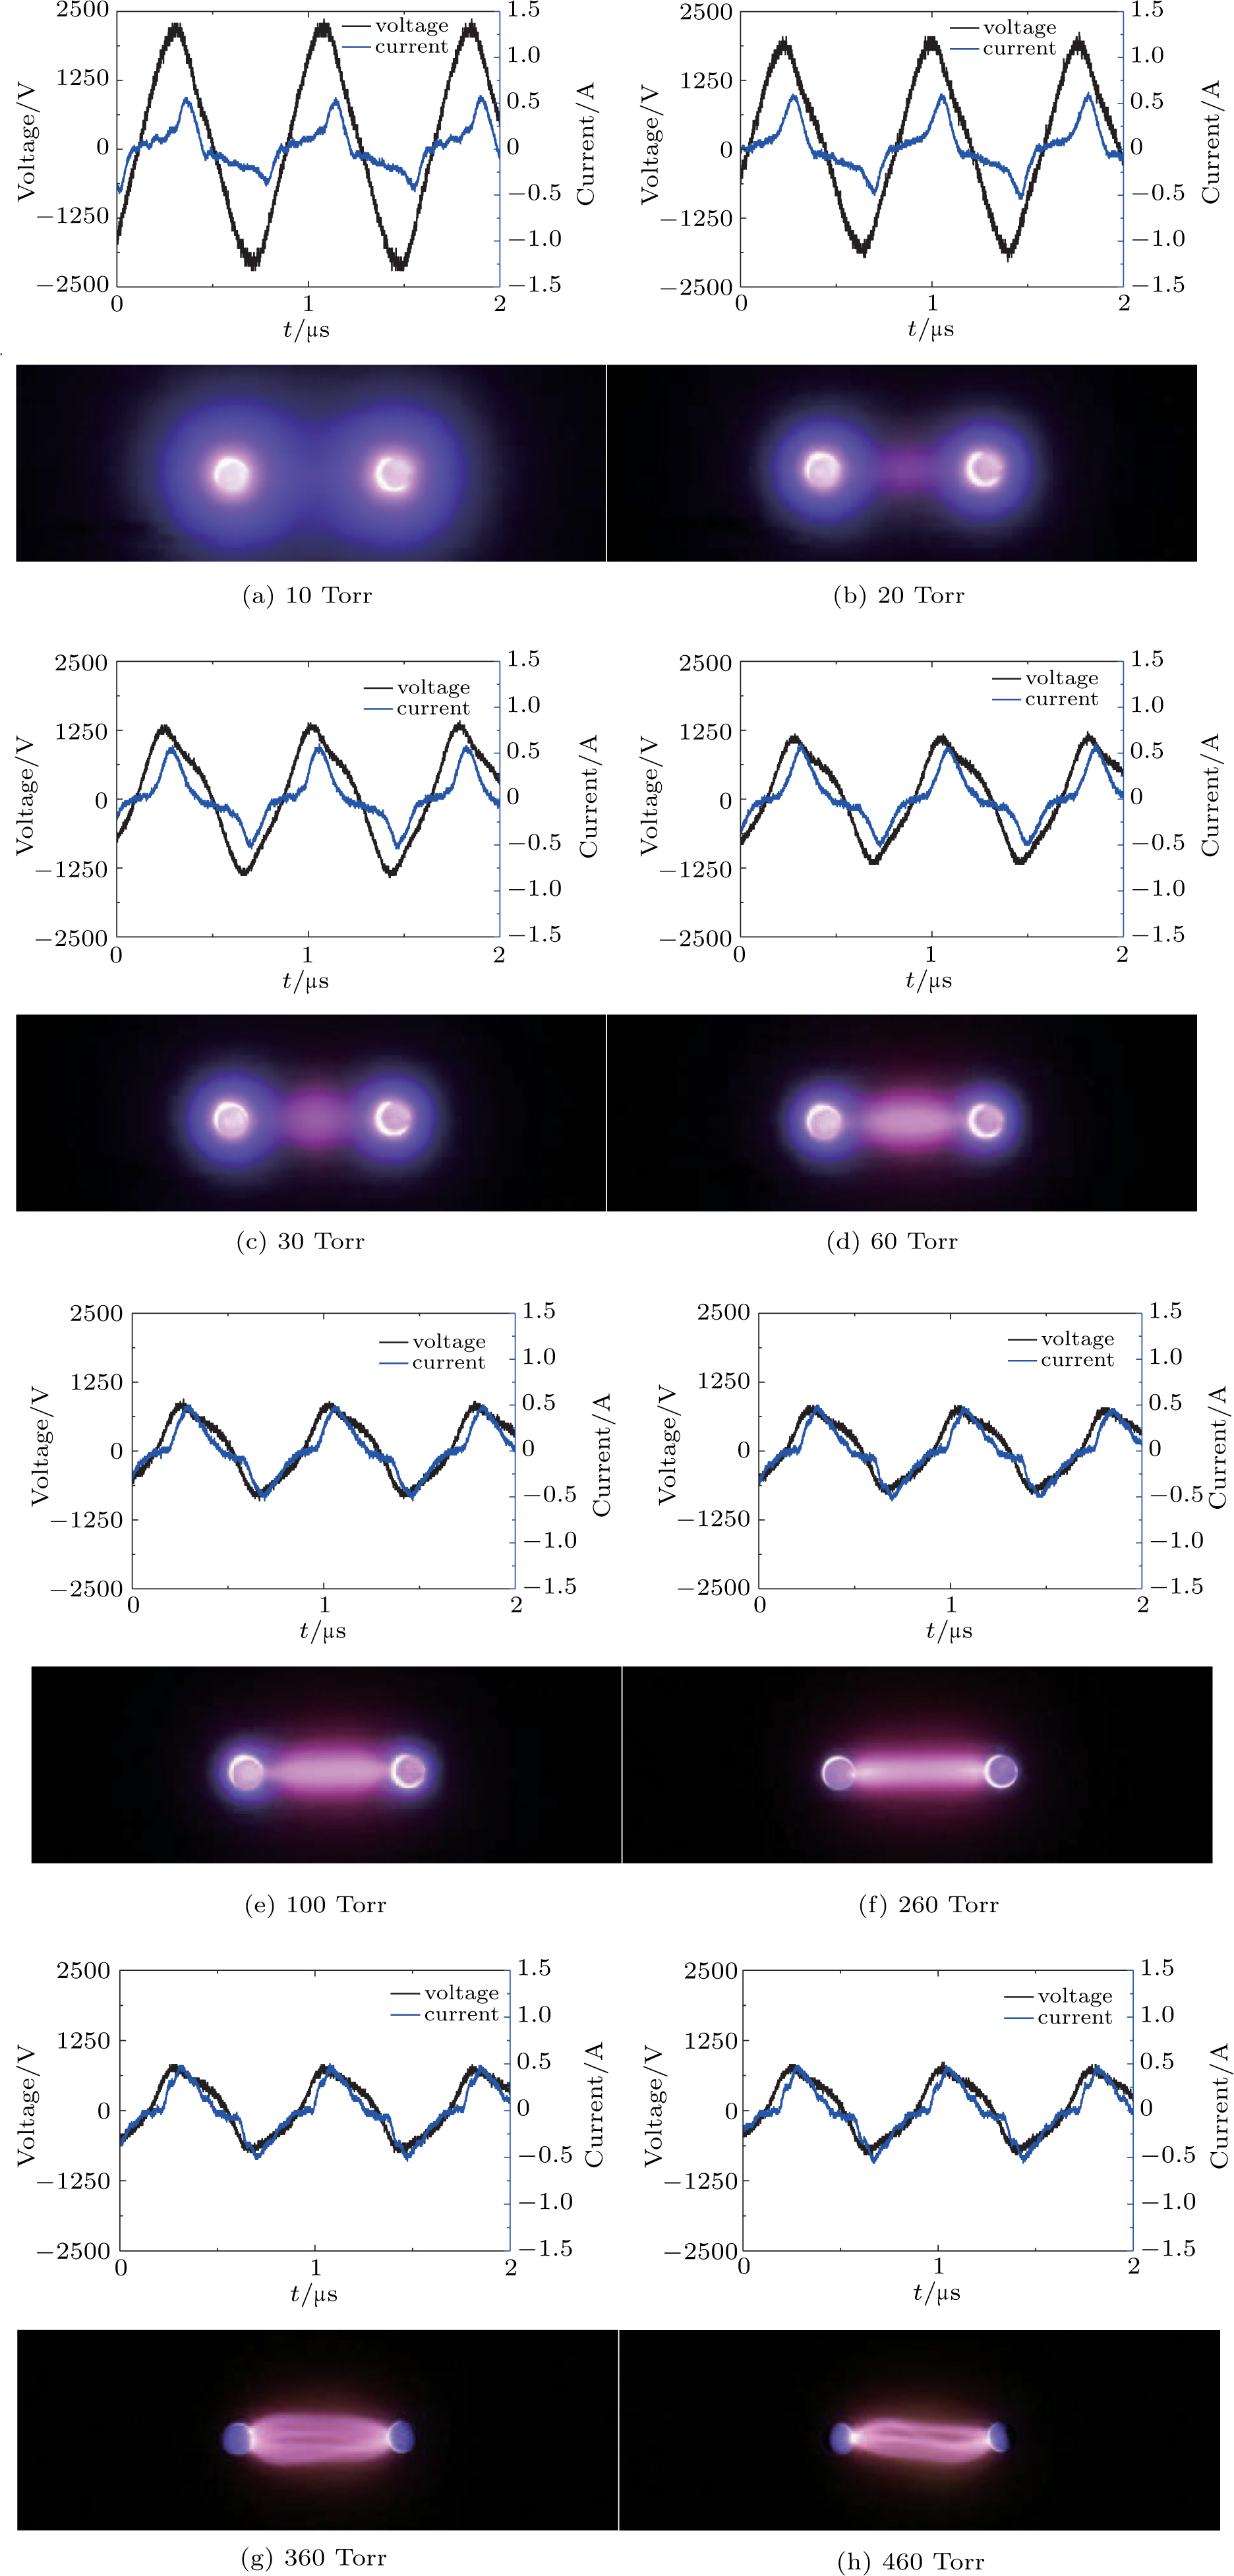
 | Fig. 2. (color online) Voltage–current waveforms and discharge images versus operating pressure. |
| Table 1.
Experimental conditions for the first series of experiments. . |
The general electrical parameters such as peak voltage, transported charge, etc. can be deduced from Q–V Lissajous figures. The area of figure represents the energy per cycle,[20] which can be calculated from
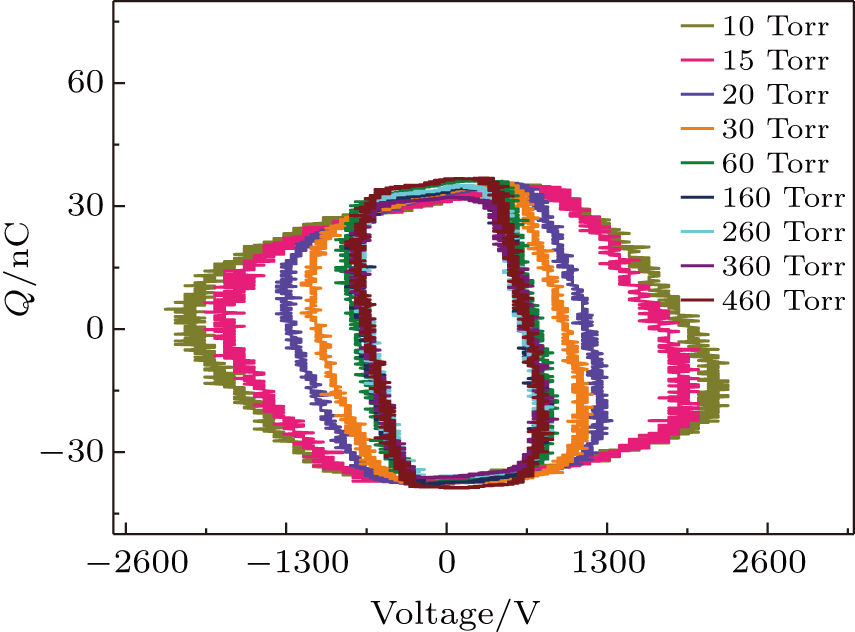 | Fig. 3. (color online) Q–V Lissajous figures versus operating pressure. |
Based on the Q–V Lissajous figure, the variation of energy per cycle can be concluded as shown in Fig.
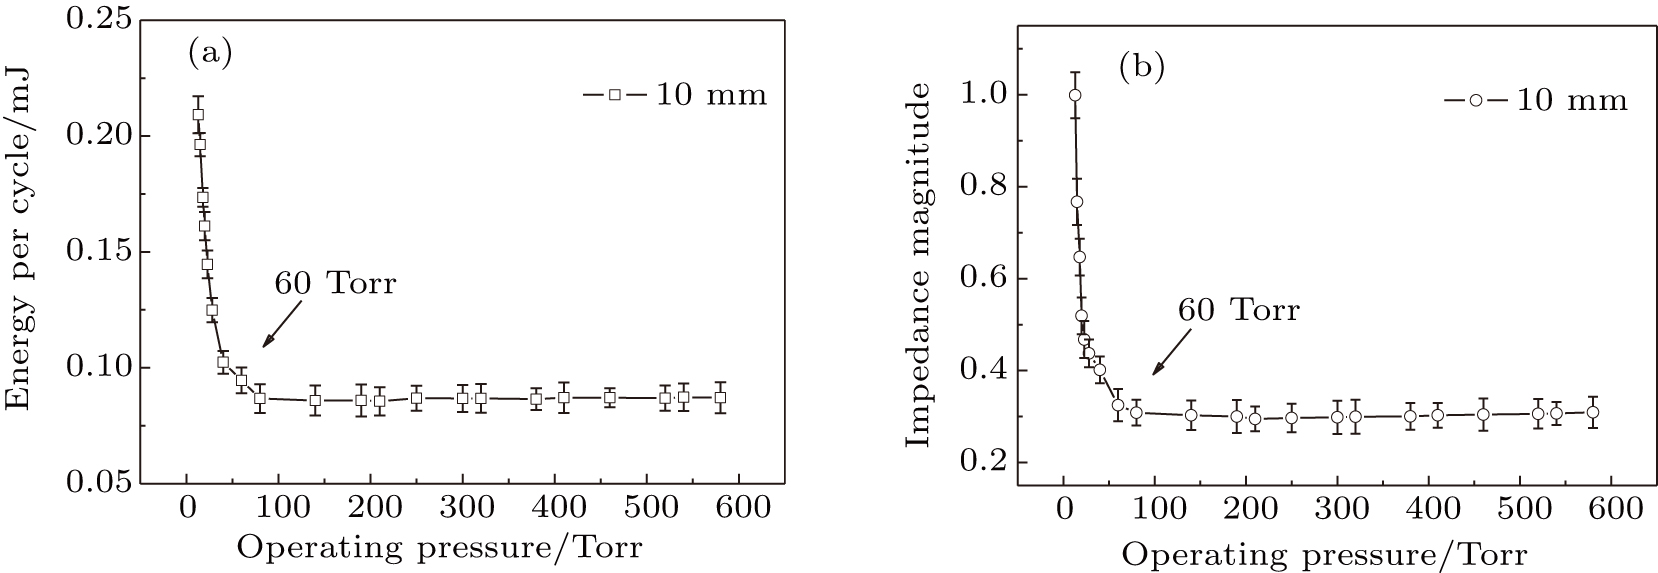
 | Fig. 4. (a) Energy per cycle and (b) impedance magnitude versus operating pressure. |
3.1.2. Influence of electrode distance on electrical characteristics
Electrode distance, as an important geometrical parameter, is closely related to the breakdown voltage and the impedance magnitude of the actuator. The experimental conditions are shown in Table
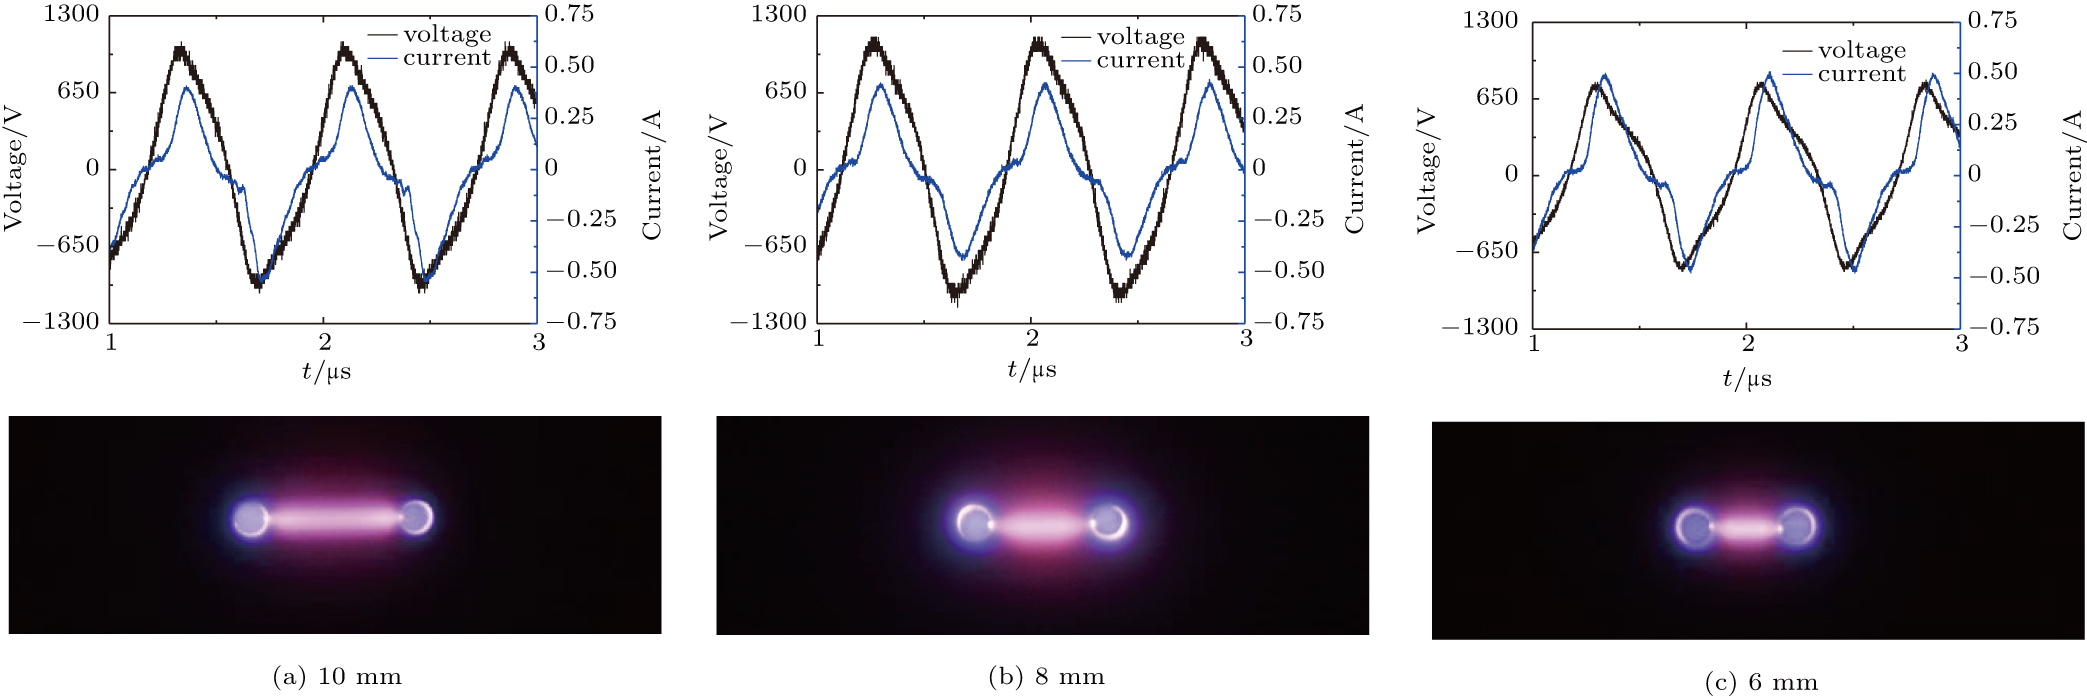
 | Fig. 5. (color online) Voltage–current waveforms and discharge images versus electrode distance. |
| Table 2.
Experimental conditions for the second series of experiments. . |
Subsequently, the Q–V Lissajous figures of different electrode distances are obtained when discharge power varies from 40 W to 80 W. As shown in Figs.
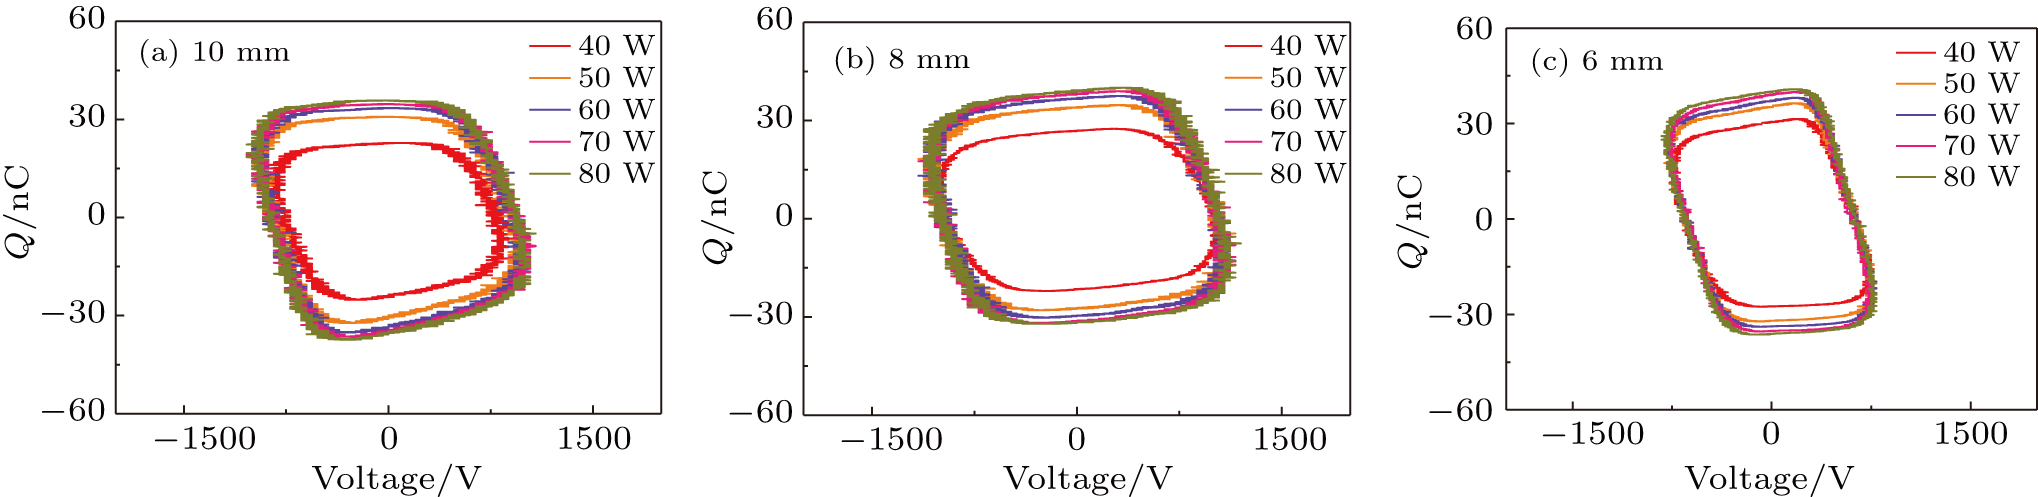
 | Fig. 6. (color online) Q–V Lissajous figures of radio frequency discharge versus electrode distance. |
From Fig.
 | Fig. 7. (color online) Variations of (a) energy per cycle and (b) impedance magnitude with electrode distance. |
3.1.3. Influence of duty cycle on electrical characteristics
The TS/TW is defined as the duty cycle, where TS is the burst width, and TW is the restart period. Figure
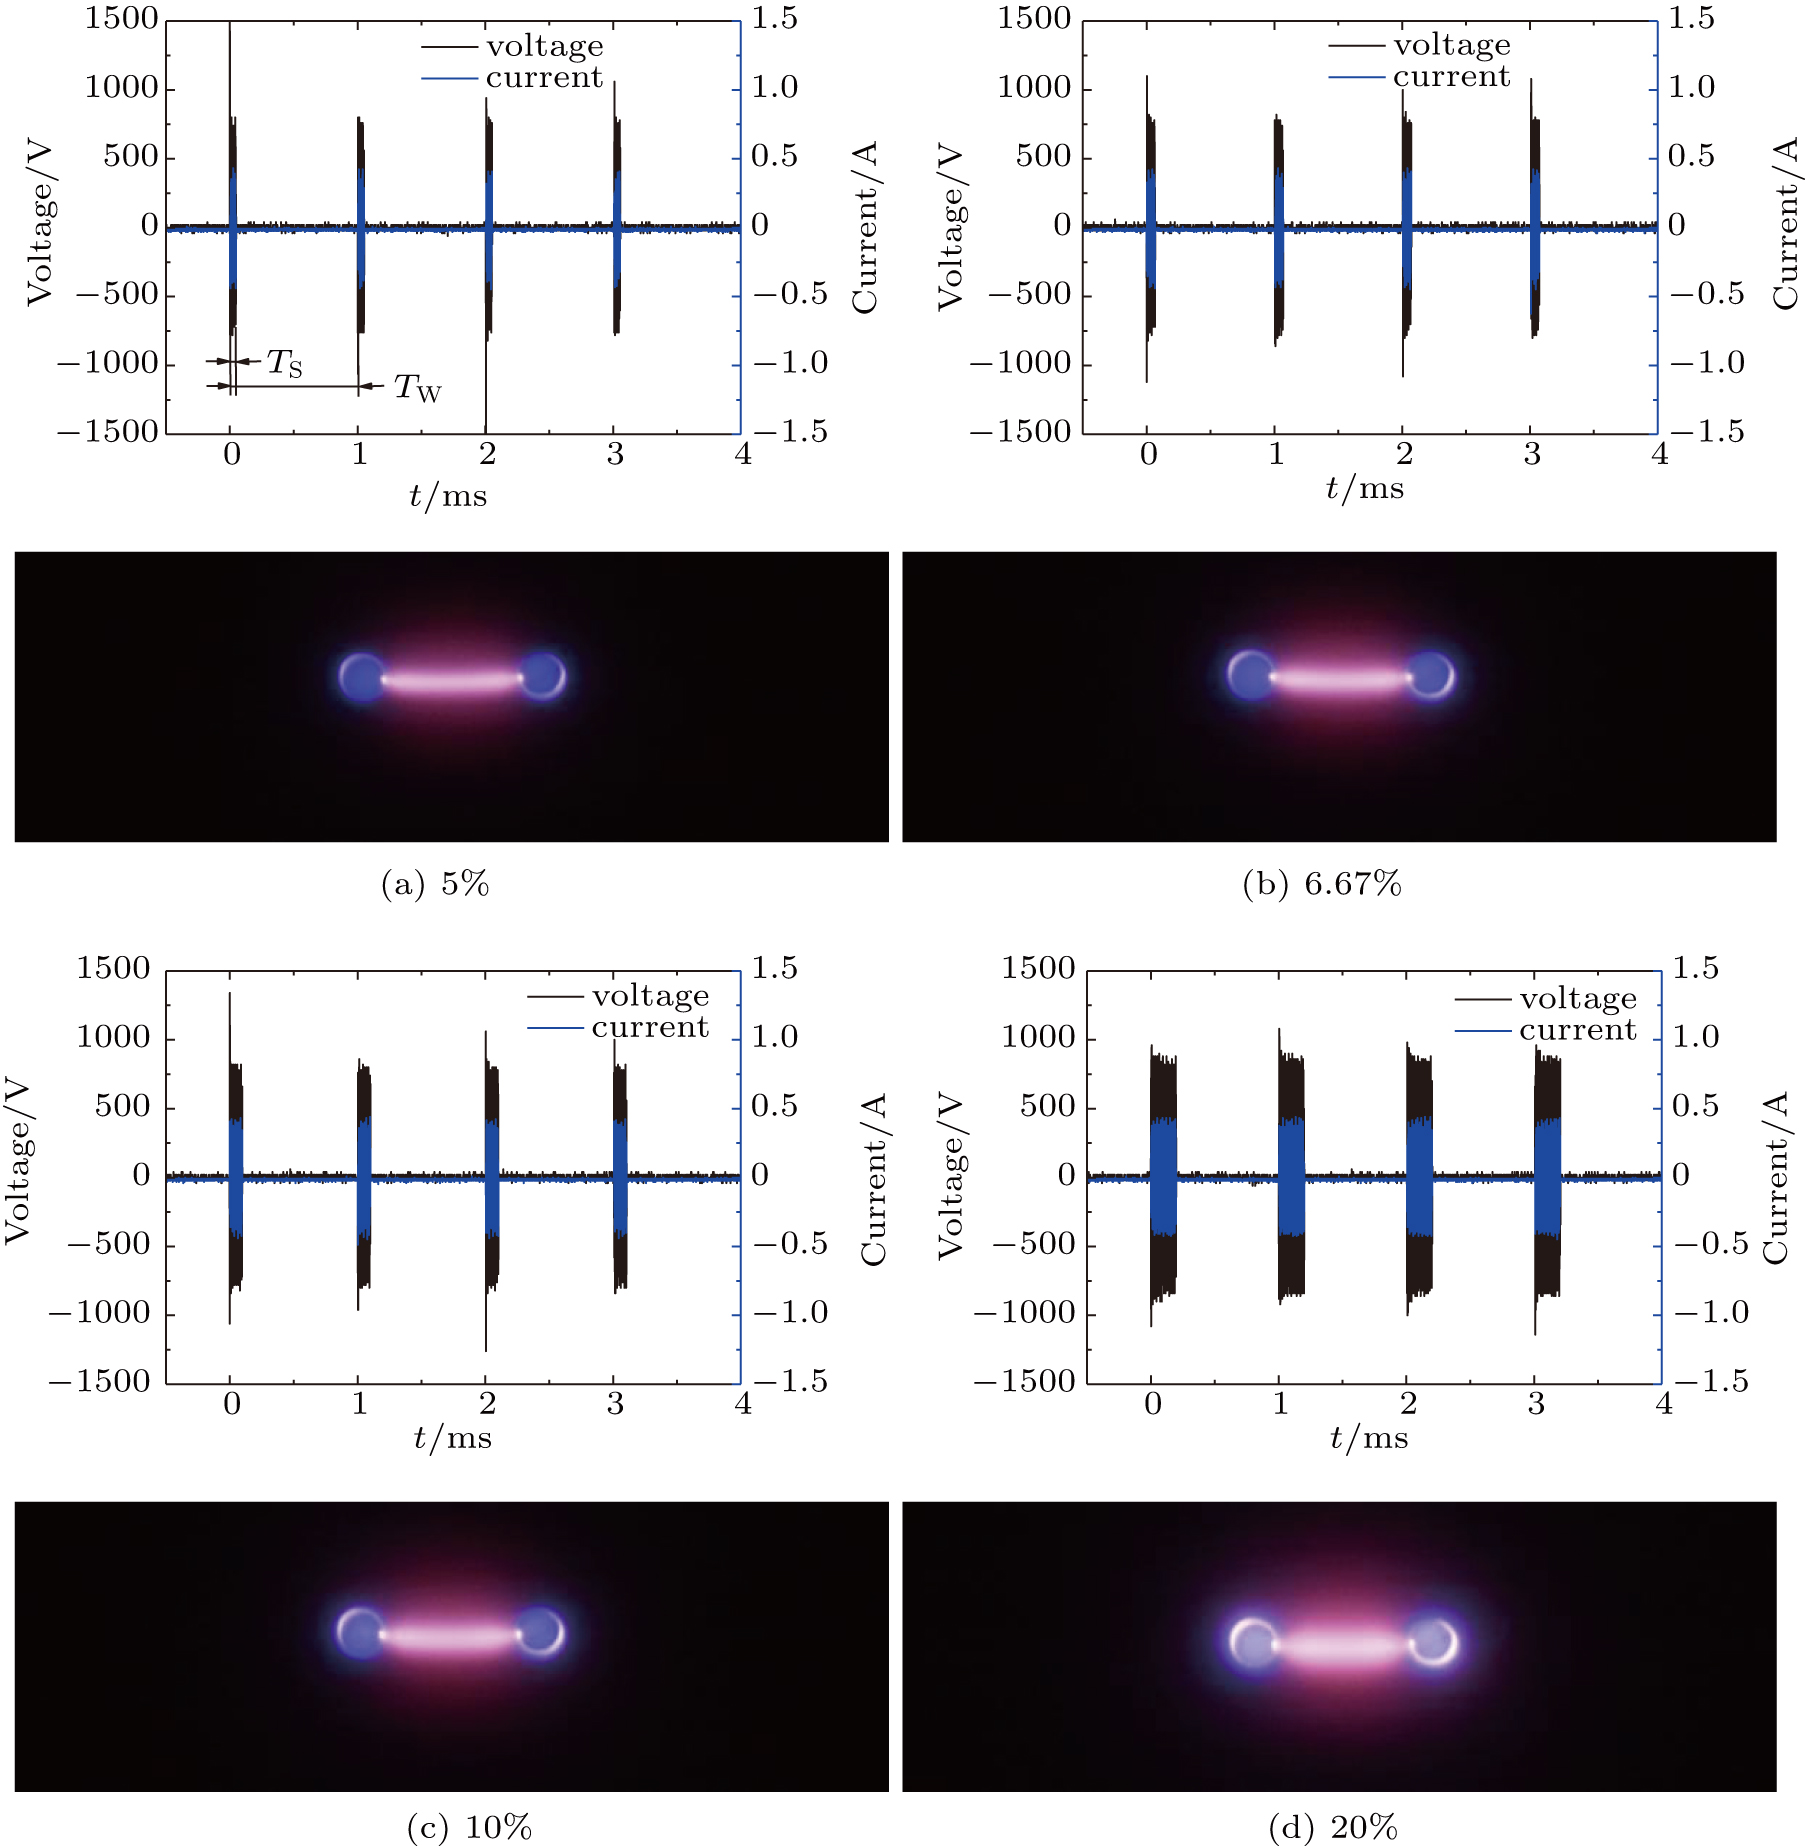 | Fig. 8. (color online) Voltage–current waveforms and discharge images with different duty cycles. |
| Table 3.
Experimental conditions for the third series of the experiments. . |
As can be seen from Figs.
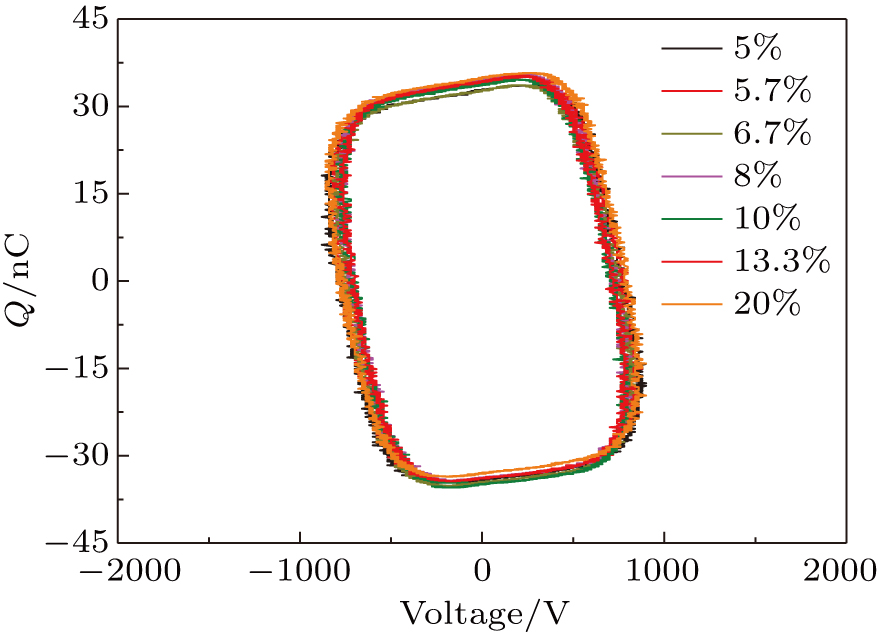 | Fig. 9. (color online) Q–V Lissajous figures versus duty cycle. |
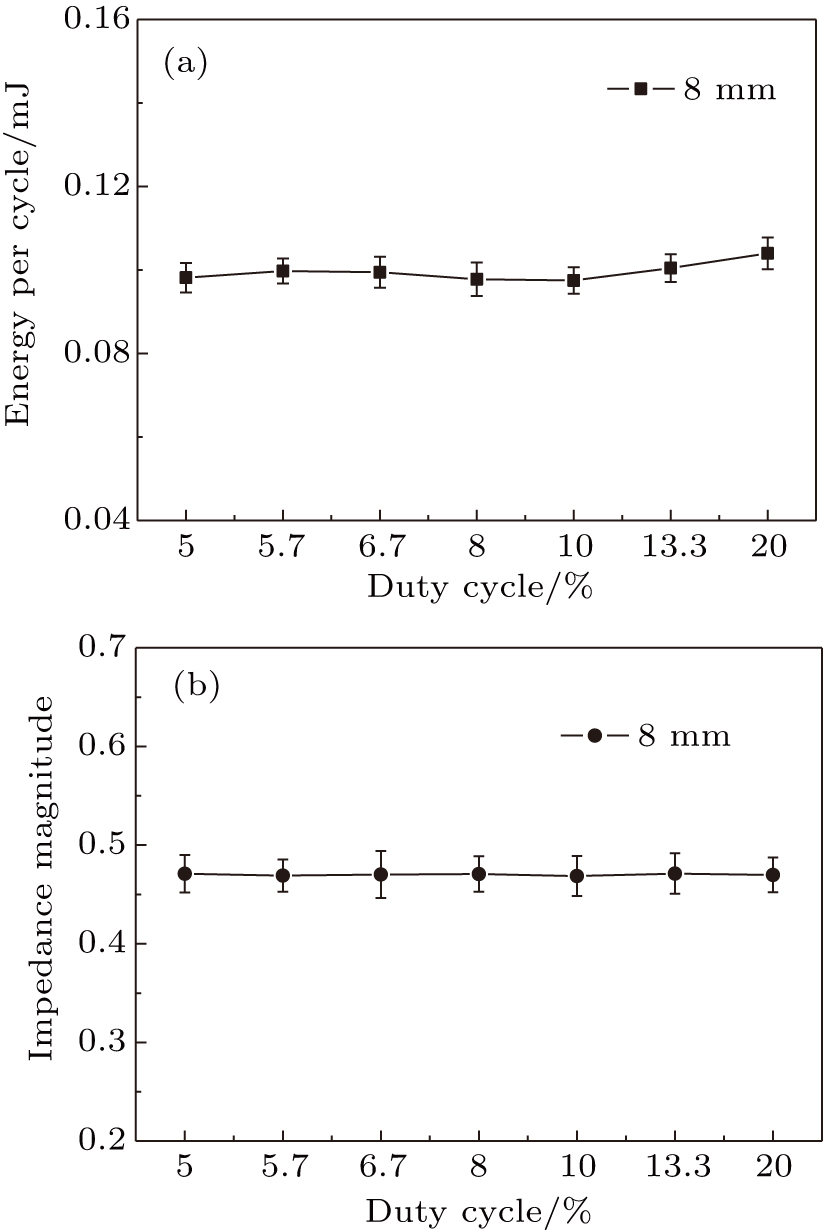
 | Fig. 10. (a) Energy per cycle and (b) impedance magnitude versus duty cycle. |
3.2. Thermal characteristics
In this subsection, the spatiotemporal distribution of the radio frequency discharge plasma temperature at low pressure is investigated, and the effects of operating pressure, electrode distance, and duty cycle on the thermal characteristics are analyzed.
3.2.1. Spatiotemporal distribution of surface temperature at low pressure
For each experimental case, the temperature measurement is not performed until the thermal equilibrium is reached among plasma, actuator, and surrounding air. In addition, the distance between the actuator and the thermal imager is only 30 mm, indicating that the heat absorbed by the water vapor and carbon dioxide is negligible. What is more, the temperature measured by the thermal imager (Tc) and the actual temperature of the actuator surface (To) are not strictly equal, and the relationship between them is expressed as follows:[11,24]
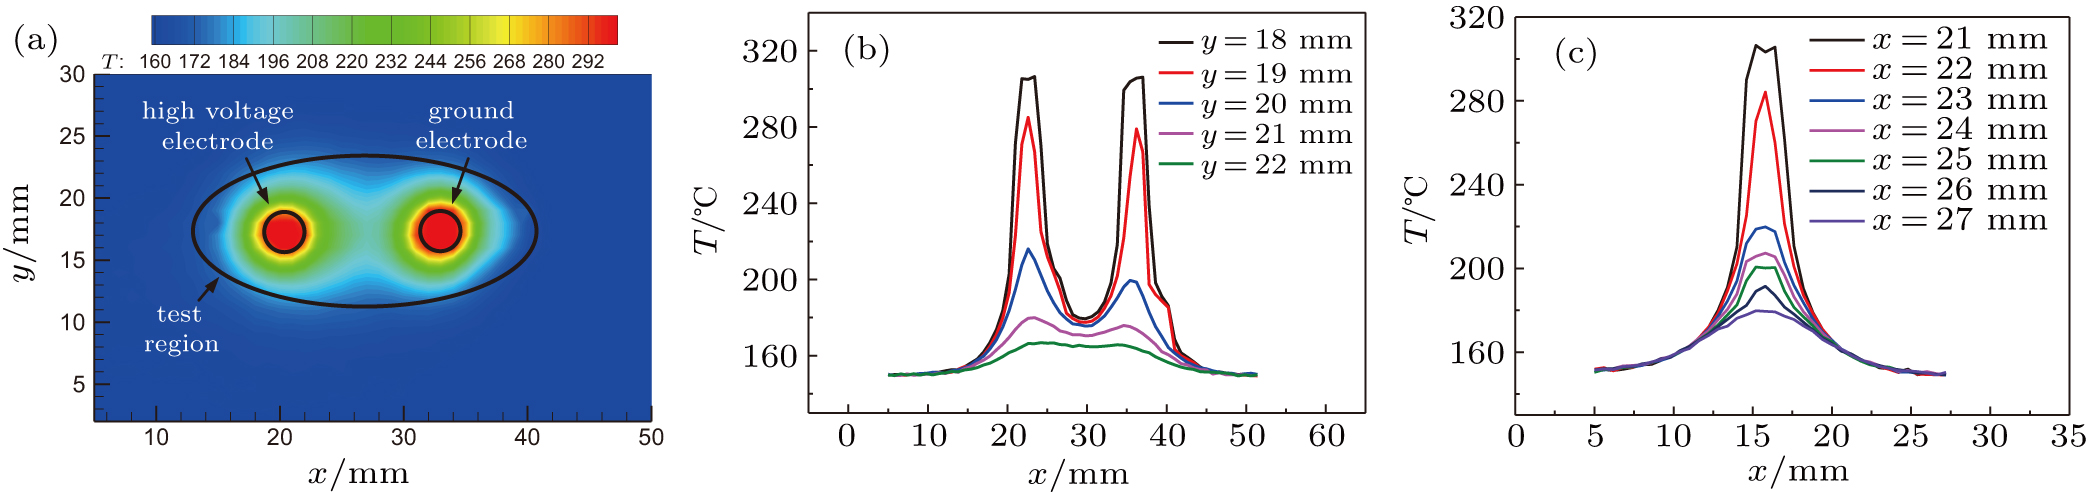
Based on the above analysis the temperature spatial distribution on the actuator surface can be obtained as shown in Fig.
 | Fig. 11. (color online) (a) Thermogram of actuator surface temperature recorded by thermal imager, (b) variations of surface temperature along (b) transversal direction and (c) longitudinal direction. |
| Table 4.
Experimental conditions for the fourth series of the experiments. . |
Since the voltage waveforms are symmetrical in the positive and negative half-cycles, the accumulation of the discharge energies converted into heat on the high voltage and ground electrode can be considered as equal, leading the temperatures of the two electrodes to be almost the same, which is quite different from the scenario in DC glow discharge where the cathode surface is hottest.[25]
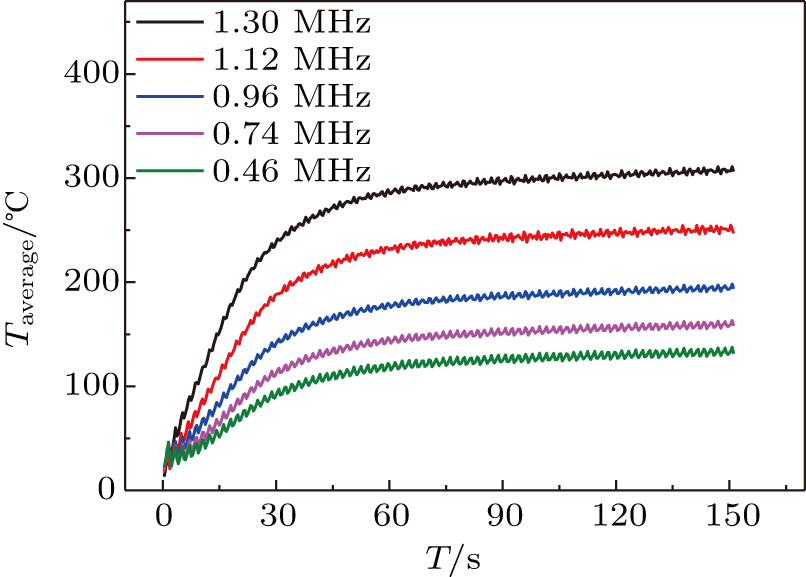
In the above thermogram the high temperature region is concentrated near the electrodes, therefore the average temperature of the elliptical area shown in Fig.
 | Fig. 12. (color online) Evolutions of the surface temperature with time. |
3.2.2. Influence of operating pressure on thermal characteristics
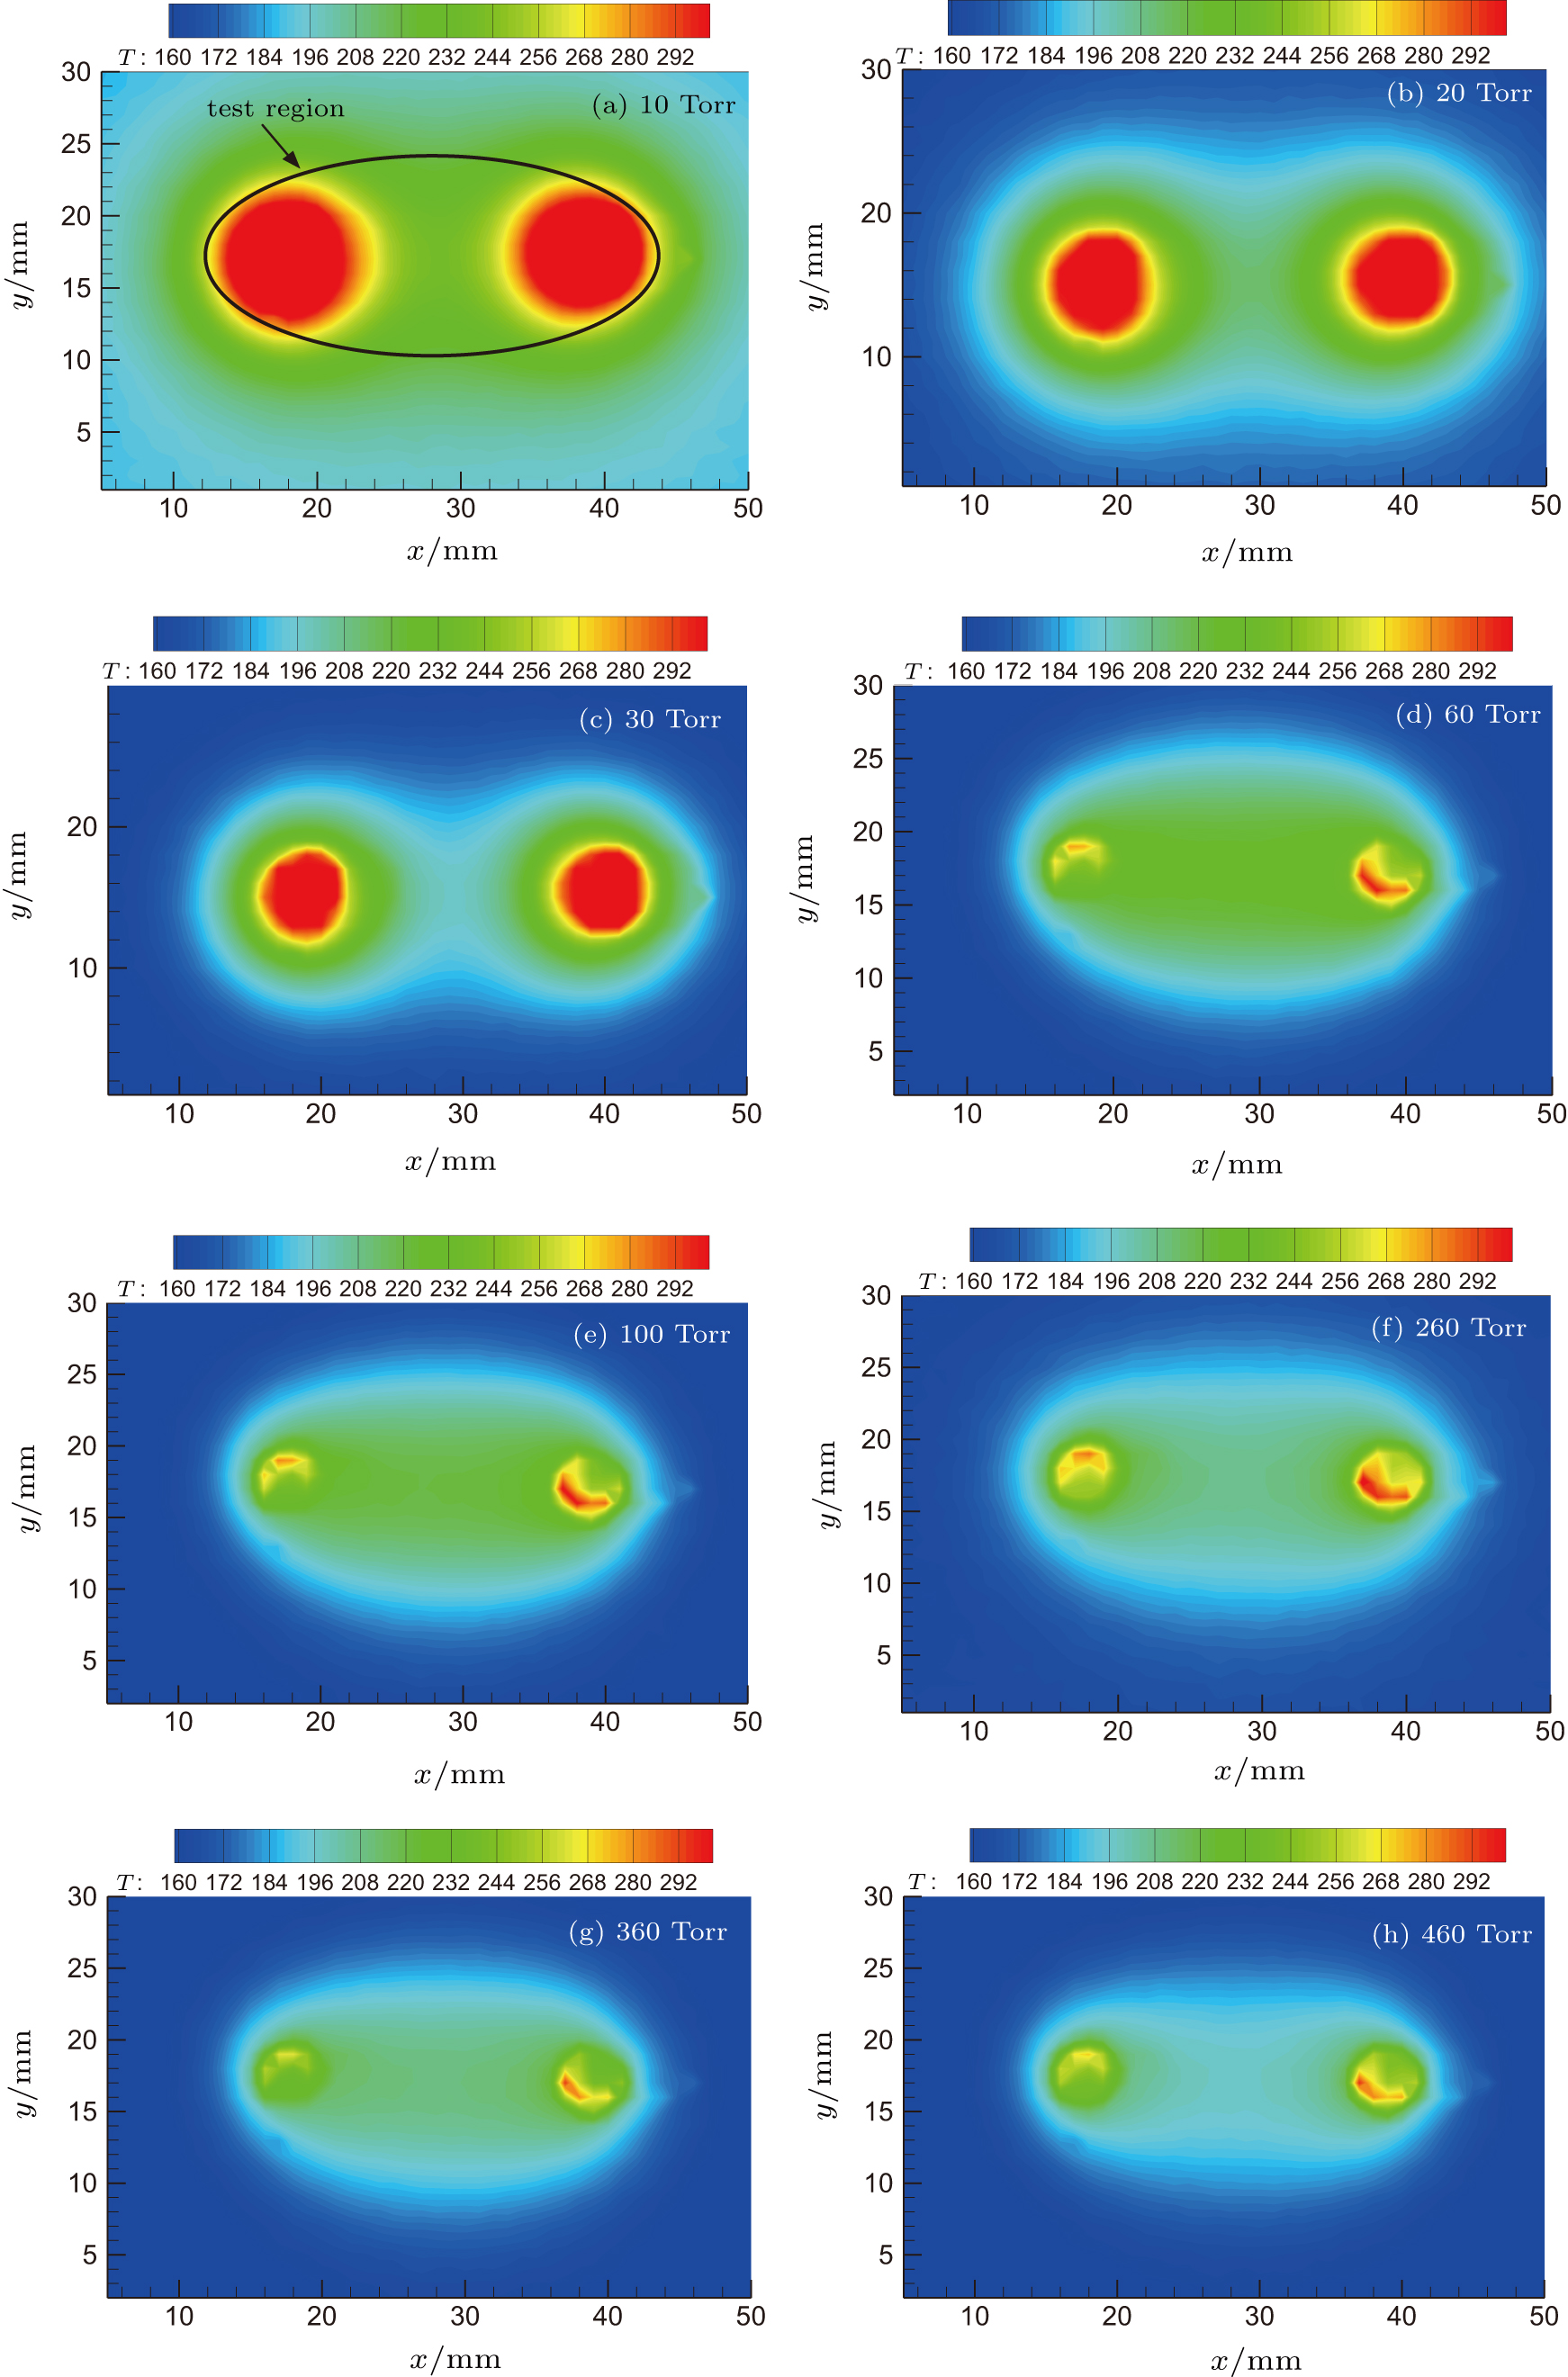
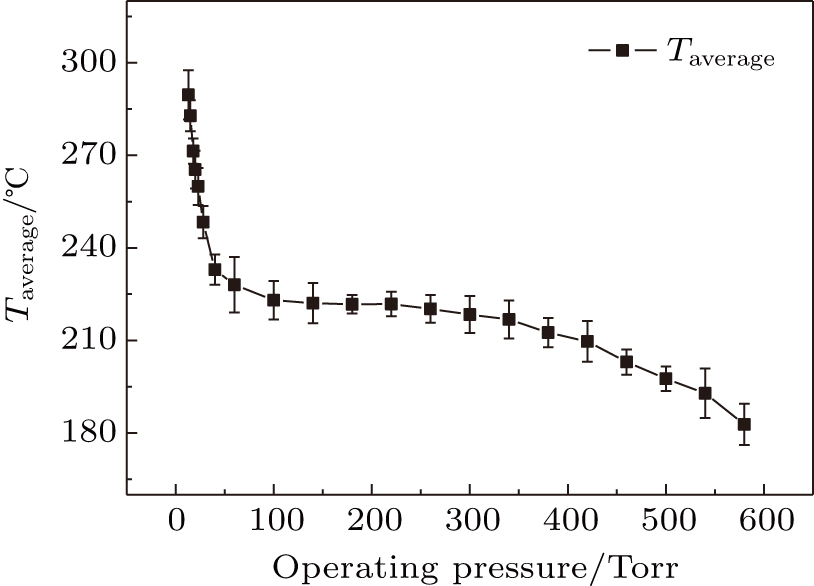
The thermograms of the radio frequency discharge under different pressures (10 Torr–460 Torr) are shown in Fig.
It can be observed that different operating pressures correspond to different surface temperatures of the actuator. Obviously, the main factor determining the surface temperature is the discharge energy converted into heat. The calculation formula of the discharge energy can be approached to the following expression:
 | Fig. 13. (color online) Thermographs of surface temperature versus operating pressure at different pressures. |
Both of them affect the accumulation of discharge energy together. According to the variation of the surface temperature shown in Fig.
 | Fig. 14. Average temperature versus operating pressure. |
3.2.3. Influence of electrode distance on thermal characteristics
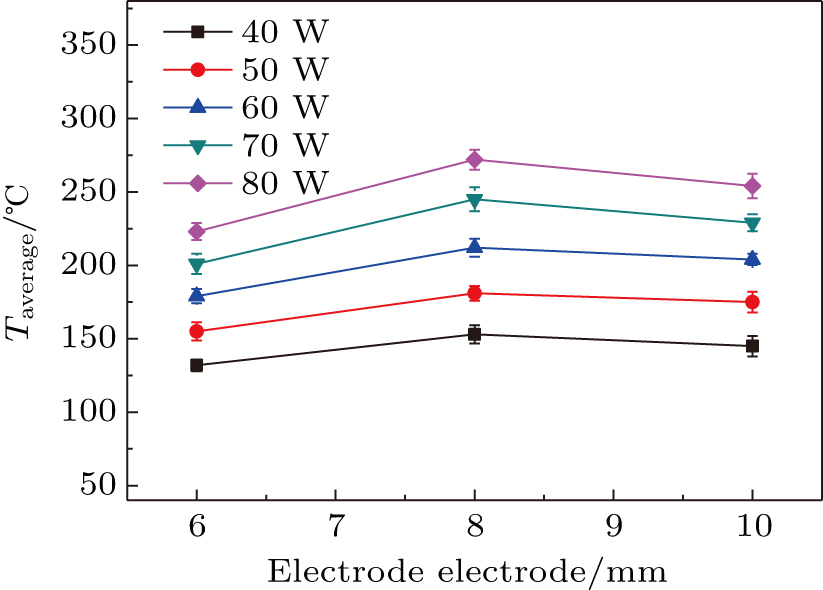
Figure
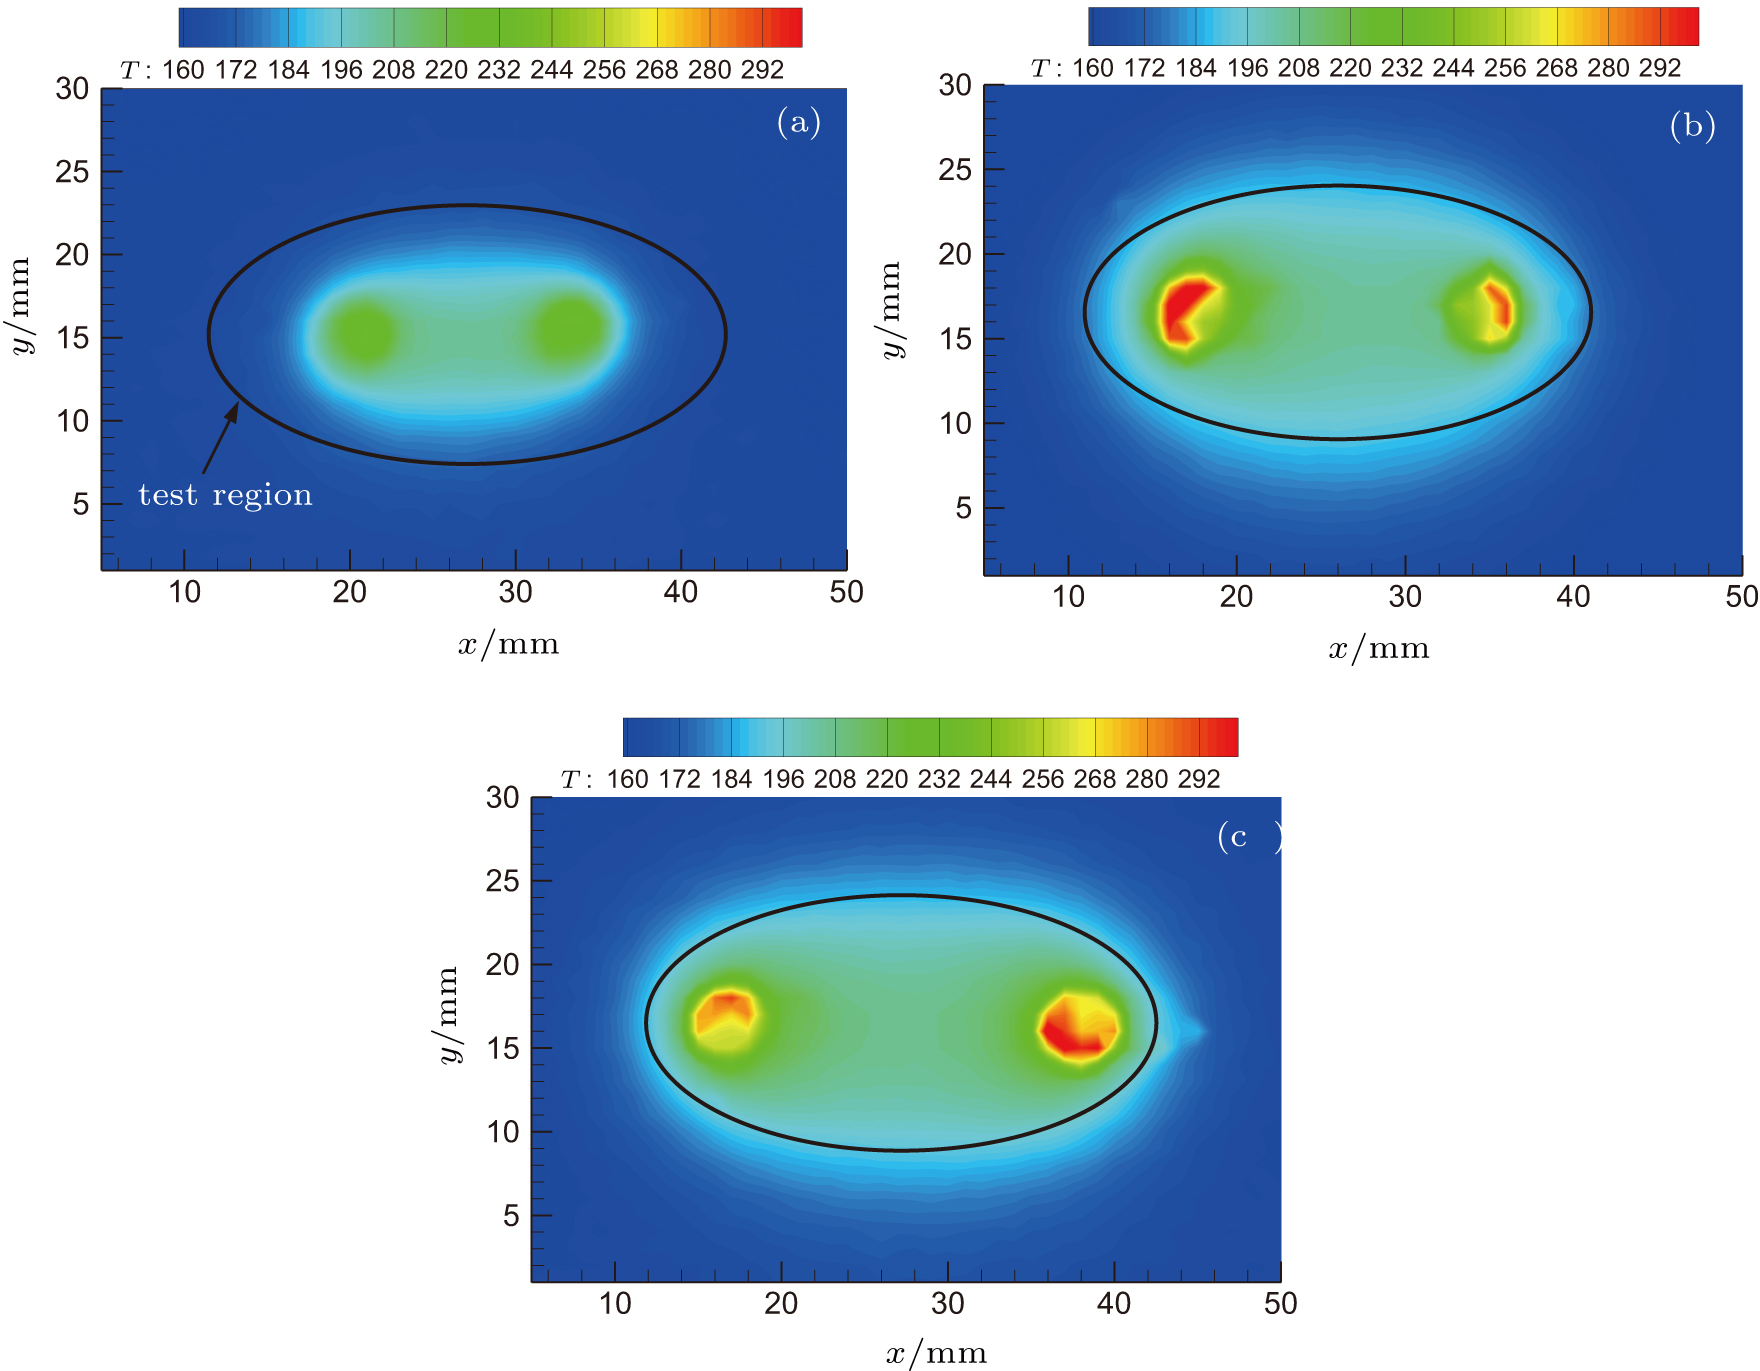 | Fig. 15. (color online) Thermographs of surface temperature varying with x under varying electrode distances: (a) 6 nm, (b) 8 nm, and (c) 10 nm. |
From Fig.
 | Fig. 16. (color online) Average temperatures versus electrode distance at different powers. |
3.2.4. Influence of duty cycle on thermal characteristics
This subsection focuses on the effect of duty cycle on the surface temperature. The experimental conditions are shown in Table
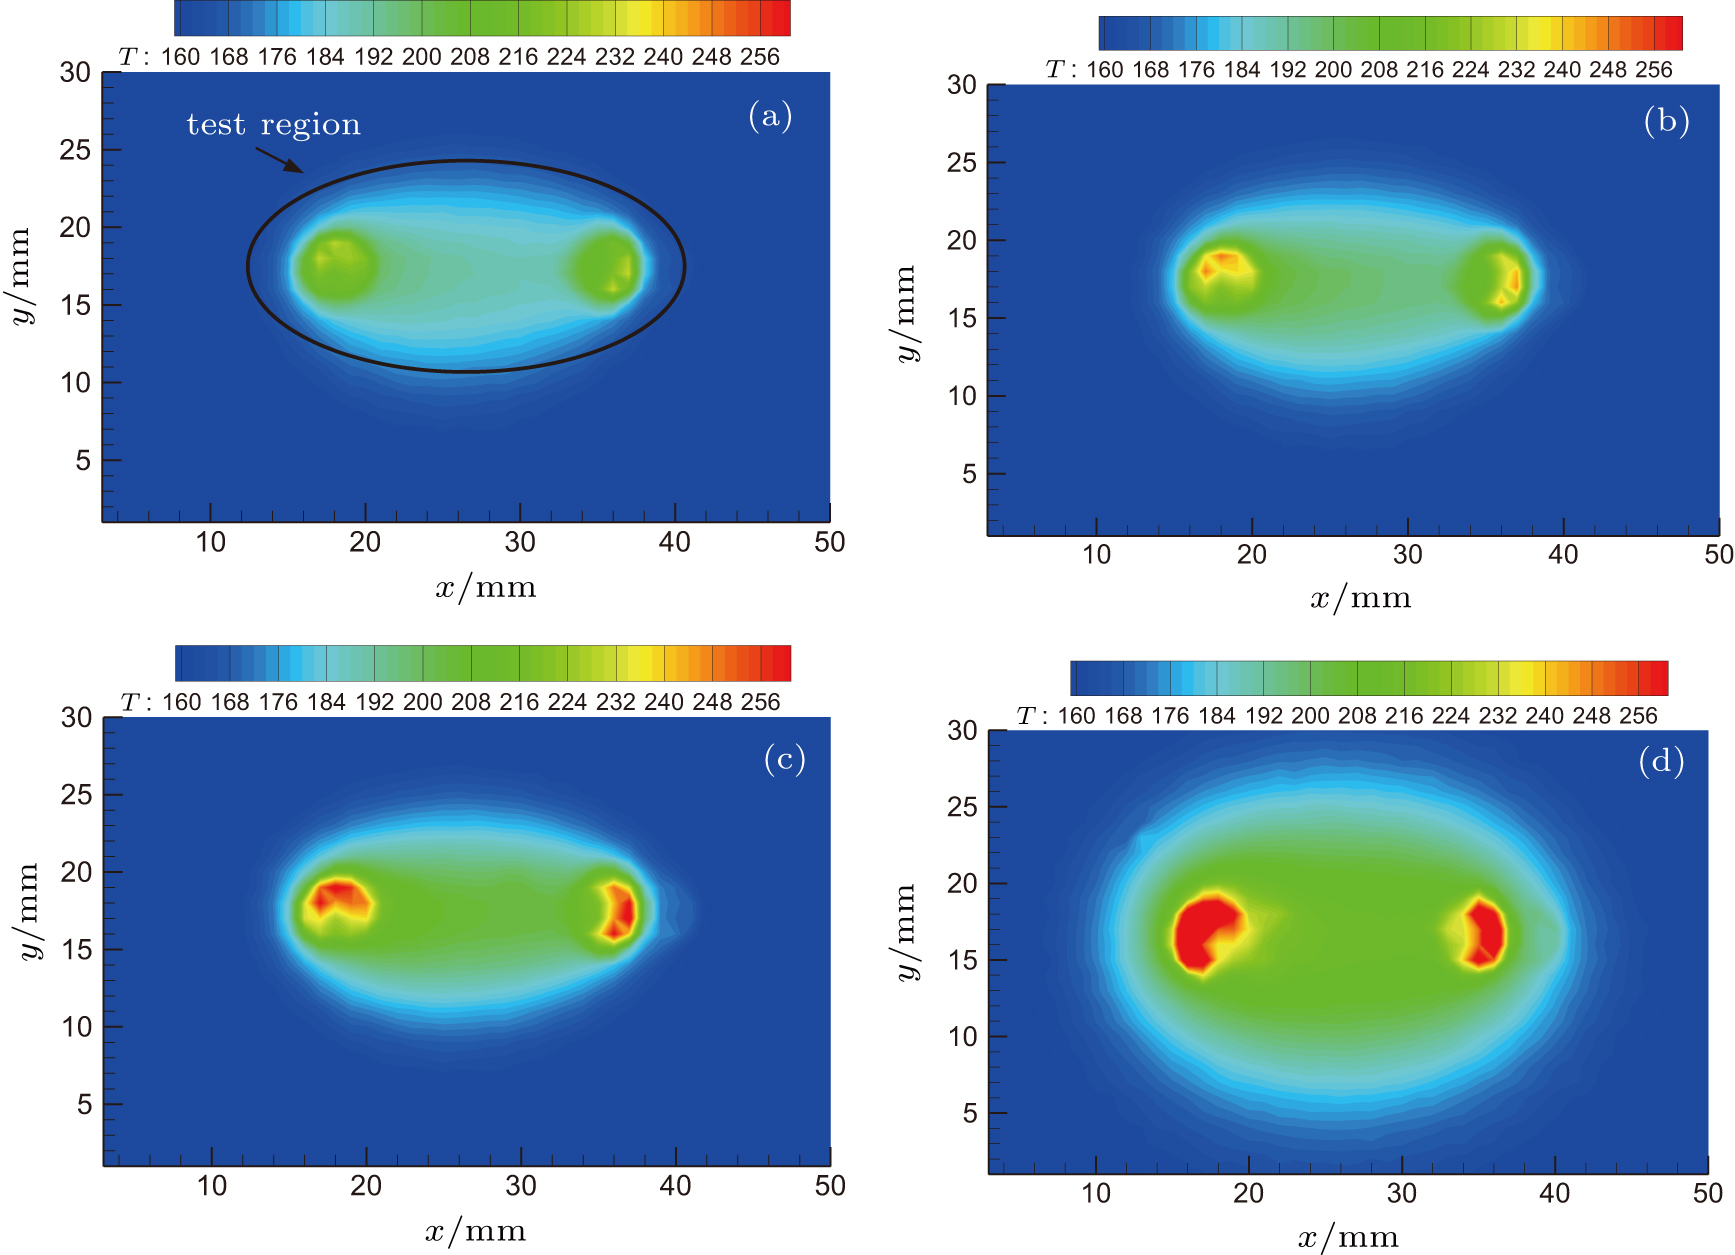 | Fig. 17. (color online) Thermographs of surface temperature versus duty cycle at different duty cycles: (a) 5%, (b) 6.7%, (c) 10%, and (d) 20%. |
From formula (
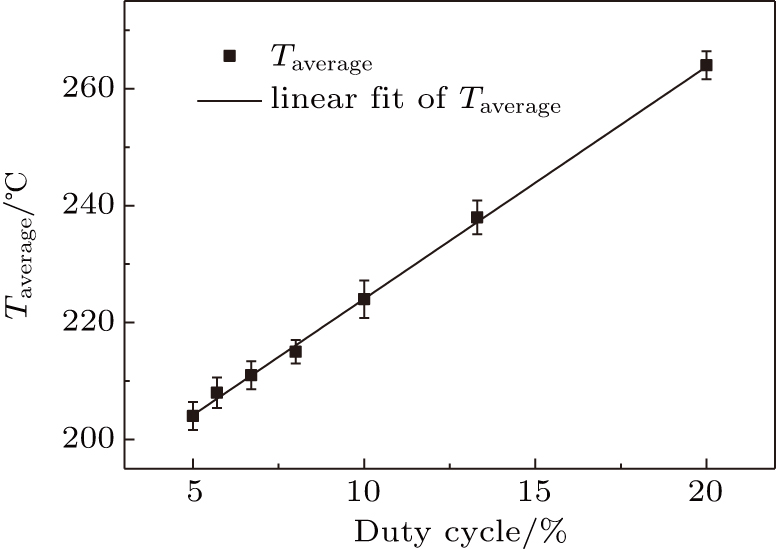 | Fig. 18. Average temperature versus duty cycle. |
4. Conclusions
The characteristics of near-surface electrical discharge plasma actuation driven by radio frequency voltage are experimentally investigated, and the influences of some parameters, such as operating pressure, electrode distance, and duty cycle are discussed. The main conclusions are as follows.
A phase difference between discharge voltage and current is observed, which is typical of a non-resistively coupled system. When the operating pressure is between 10 Torr and 20 Torr, the voltage waveforms are smooth continuous sine waves, and an obvious single peak pattern is shown in each half cycle for the current waveform. A diffuse luminous discharge is clearly visible around the electrodes, from which a diffuse glow discharge mode can be deduced. With operating pressure varying from 30 Torr to 460 Torr, a luminous discharge channel appears between two electrodes, and the voltage waveform is distorted near the current peak. Under different operating pressures, the shapes of Q–V Lissajous figures are quasi-parallelogram, and the slopes of both left and right sides are negative due to the voltage phase being ahead of the current phase. Under the given conditions, at 10 Torr the area of the Q–V Lissajous figure is biggest. When operating pressure ascends from 10 Torr to 60 Torr, the area gradually decreases, so does the corresponding slope. At pressure higher than 60 Torr, the change of the area is negligible.
For a fixed electrode distance, the area of the Lissajous figure gradually increases with the increase of discharge power. For a fixed power, the shape of the Q–V Lissajous figure varies with electrode distance. The area of Q–V Lissajous figure corresponding to the electrode distance of 8 mm is largest, while the area for 6 mm is smallest. For certain experimental parameters, an optimal electrode distance exists, thereby the best impedance matching between actuator and radio frequency power supply can be achieved.
The duty cycle has little influence on the voltage–current waveform, QV Lissajous figure, and energy per cycle, while the discharge intensity increases as duty cycle rises. The temperature of the high voltage electrode and the ground electrode are almost equal, which is different from the result of DC glow discharge. The surface temperature of the plasma actuator rises rapidly after breakdown, and then the rising rate gradually decreases. Approximately 150 s after discharge, thermal equilibrium is achieved among plasma, actuator, and air.
Under lower pressure, the high temperature region is concentrated on the electrode surface. As operating pressure increases, the high temperature region turns to be evidently spindly. The average temperature corresponding to the electrode distance of 8 mm is highest, while it is lowest when the electrode distance is 6 mm. With the increase of duty cycle, the average temperature basically increases linearly, and the high temperature region also increases gradually.
For the purpose of improving the aerodynamic control efficiency for the shock wave with supersonic flow, the future work should focus on the influence of supersonic flow on the characteristics of radio frequency discharge. What is more, based on the study of the characteristics the control of the shock strength and drag by radio frequency discharge actuation in wind tunnel experiments will also be investigated.
Reference
| [1] | |
| [2] | |
| [3] | |
| [4] | |
| [5] | |
| [6] | |
| [7] | |
| [8] | |
| [9] | |
| [10] | |
| [11] | |
| [12] | |
| [13] | |
| [14] | |
| [15] | |
| [16] | |
| [17] | |
| [18] | |
| [19] | |
| [20] | |
| [21] | |
| [22] | |
| [23] | |
| [24] | |
| [25] |