Time-resolved shadowgraphs and morphology analyses of aluminum ablation with multiple femtosecond laser pulses
Wu Zehua1, †, Zhang Nan2, ‡, Zhu Xiaonong2, An Liqun1, Wang Gangzhi1, Tan Ming1
Department of Physics, School of Science, Tianjin University of Science & Technology, Tianjin 300222, China
Institute of Modern Optics, Nankai University, Key Laboratory of Opto-electronic Information Science and Technology, Ministry of Education, Tianjin 300071, China


† Corresponding author. E-mail: wuzehua@tust.edu.cn zhangn@nankai.edu.cn

Project supported by the Science and Technology Development Fund Planning Project for the Universities of Tianjin, China (Grant No. 20140902), the Natural Science Foundation of Tianjin City, China (Grant No. 16JCQNJC01900), the National Natural Science Foundation of China (Grant Nos. 51376136 and 61474082), and the Science and Technology Achievement Award Project for the Universities of Tianjin, China.

Abstract

Aluminum ablation by multiple femtosecond laser pulses is investigated via time-resolved shadowgraphs and scanning electron microscope (SEM) images of the ablation spot. The spatial distribution of the ejected material and the radius of the shock wave generated during the ablation are found to vary with the increase in the number of pulses. In the initial two pulses, nearly concentric and semicircular stripes within the shock wave front are observed, unlike in subsequent pulses. Ablation by multiple femtosecond pulses exhibits different characteristics compared with the case induced by single femtosecond pulse because of the changes to the aluminum target surface induced by the preceding pulses.

1. Introduction

Femtosecond laser ablation has important applications in many scientific and engineering fields, such as nano-and micro-machining,[18] surface modification,[912] and nanoparticle generation.[1315] Many theories have been proposed to explain the physical mechanisms of femtosecond laser ablation, including phase explosion,[16] critical point phase separation,[17] Coulomb explosion,[18] fragmentation,[19] and thermoelastic waves.[20] However, the difference between single-pulse ablation and multi-pulse ablation by femtosecond laser has not been sufficiently investigated, and this should be remedied because ablation by multiple femtosecond pulses exhibits different characteristics compared with the case induced by single femtosecond pulse, which is notable for the applications of femtosecond laser ablation.

When multiple pulses irradiate the same spot on the target surface, it has been reported that the ablation threshold decreases with the increase in the number of femtosecond laser pulses,[21,22] which is known as the incubation effect. A few previous works on ablation by multiple femtosecond laser pulses have mainly concentrated on the morphology of the ablated spot.[2125] However, the material ejection and shock wave evolution are also notable experimental phenomena in this process, and some works have investigated the shock wave and the ejected material and got some helpful results.[2631] Therefore, in combination with the morphology analyses, the investigation of the ultrafast dynamics of the material ejection and shock wave evolution induced by a sequence of femtosecond laser pulses presented in this paper elucidates the mechanisms of multiple femtosecond pulses ablation.

This study recorded the dynamic evolution process of the shock wave and ejected material induced by aluminum ablation with multiple femtosecond laser pulses via time-resolved shadowgraphs, and the morphology of the ablated spots was observed with a scanning electron microscope (SEM). The radius of the shock wave and the spatial distribution of the ejected material were found to vary with the increase in the number of femtosecond laser pulses at specific delay time after the target was irradiated by a laser pulse. In addition, in the initial two femtosecond laser pulses only, nearly concentric and semicircular stripes within the shock wave front were observed in the shadowgraphs recorded at a delay time of 2 ns. Solidified aluminum droplets were observed at the ablated spot, indicating the occurrence of thermal effect in the process of the femtosecond laser ablation in our experiments.

2. Experimental setup

A Ti:Sapphire femtosecond laser amplifier system (HP-Spitfire, Spectra-Physics, Inc.) was employed to generate 50-fs laser pulses with a central wavelength of 800 nm. The schematic of the experiment setup is shown in Fig. 1, which includes a two-color pump–probe apparatus for recording the time-resolved shadowgraphs of the shock wave and ejected material. The laser output from the amplifier is divided into a pump beam and a probe beam by a 70:30 beam splitter. The pump beam is directed by steering mirrors and then focused on the aluminum target surface by an off-axis parabolic mirror with a focal length of 50.8 mm. The probe beam frequency is doubled by a BBO crystal with a thickness of 2 mm and Type I phase matching. The length of the delay line, i.e., the length of the probe beam’s path, can be adjusted to change the delay time at which the probe beam laser pulse illuminates the edge of the aluminum target and the ablation-generated material and shock wave propagate along the direction perpendicular to the probe beam, whereby the shadowgraphs of the ablation-generated material and shock wave can be recorded at a certain delay time after a laser pulse strikes the aluminum target.
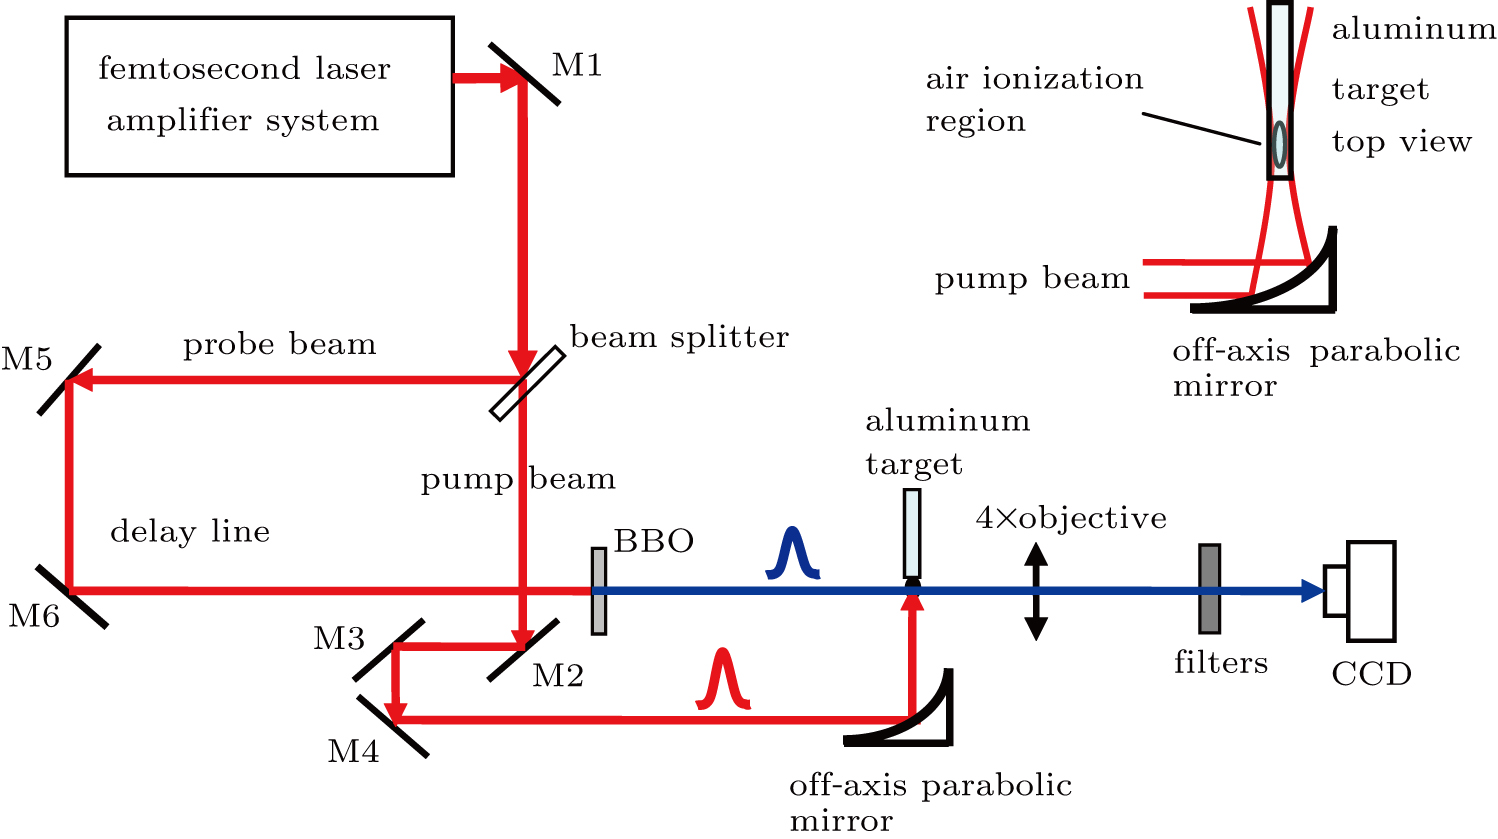
Fig. 1. (color online) Experimental setup for recording the ultrafast time-resolved shadowgraphs of femtosecond laser ablation of aluminum.

The aluminum target was polished with #2000 sandpaper and mounted on a three-dimensional motor-controlled translation stage. The pump laser pulse energy was 0.22 mJ. The corresponding laser fluence at the focal point of the off-axis parabolic mirror was sufficiently high to ionize the ambient air. To avoid the air ionization, when the shadowgraphs of the femtosecond laser ablation were recorded, the aluminum target was placed slightly in front of the air ionization region, as shown by the target top view in Fig. 1. The corresponding average laser fluence on the target surface was estimated to be 5.3 J/cm2. The femtosecond laser amplifier system was operated in the single shot mode, each ablated spot on the target surface was irradiated by eight successive pulses at the same delay time, and the time interval between adjacent pulses was sufficiently long that the interaction between the ablation-ejected material and the subsequent laser pulse was nonexistent. The time-resolved shadowgraphs of the ejected material and shock wave were recorded by a monochromatic CCD camera (LU135M, Lumenera Inc.). A 400-nm band pass filter and several neutral density filters were used to prevent the residual 800-nm light in the probe beam and the fluorescence generated during the ablation from entering the CCD camera.

3. Results and discussion

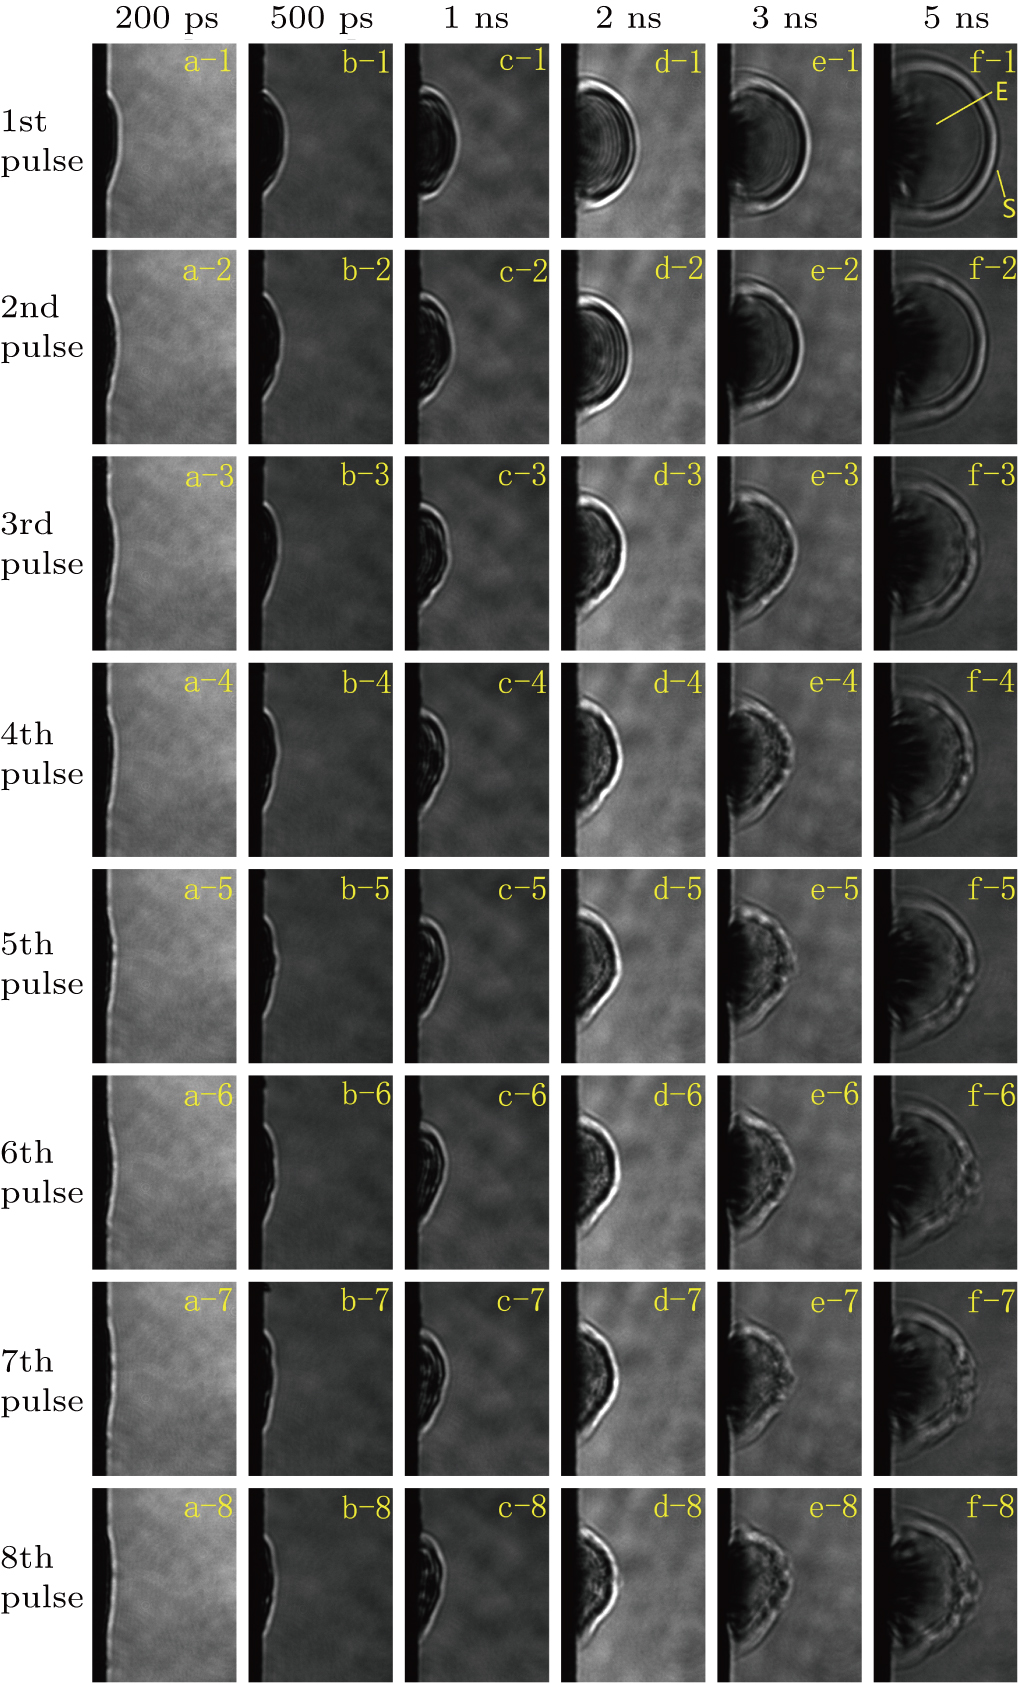
Figure 2 shows the time-resolved shadowgraphs of 50-fs laser pulse ablation of aluminum in air. In each shadowgraph, the black region on the left is the aluminum target, and the laser pulse comes from the right, striking the target at normal incidence. Each ablated spot on the target surface was irradiated by a train of eight successive laser pulses, and each column in Fig. 2 presents the eight shadowgraphs of ablating an identical spot by the eight successive laser pulses recorded at identical delay time. Each row in Fig. 2 presents the entire dynamic ablation process by the laser pulses with identical ordinal in the six groups of pulse trains from 200-ps to 5-ns delay time.

Fig. 2. Shadowgraphs of 50-fs laser pulse ablation of aluminum recorded at the indicated delay time. In panel (f-1), S is the shock wave front and E is the ejected material. Frame size is 112 μm× 151 μm.

The shadowgraphs in the first row of Fig. 2 show the first laser pulse ablation of six groups of pulse trains at different delay times, corresponding to the case of single-pulse ablation at different delay times. The following features are identified: (i) at the 200-ps delay time, an opaque bulge of dense plasma protrudes from the target surface; (ii) the expansion of the plasma forms a shock wave, which propagates outwards as time elapses; (iii) a series of nearly concentric and semicircular stripes appear within the shock wave front at delay times of 1 ns and 2 ns, becoming blurred at the 3-ns delay time, as observed in previous experiments;[2931] and (iv) the ejected material in the interior of the shock wave is observed clearly beginning at the 3-ns delay time.

Comparing the shadowgraphs in the first row with those in the other rows of Fig. 2, significant differences between multi-pulse ablation and single-pulse ablation are shown: (i) for the first four laser pulses, the volume of the plasma bulge and the radius of the shock wave clearly decrease with increasing numbers of laser pulses at the identical delay time, and then remain almost unchanged from the fourth through the eighth laser pulse; (ii) the area covered by the ejected material induced by the second laser pulse is larger than that induced by the first laser pulse; (iii) the nearly concentric and semicircular stripes that were clearly observed at the 2-ns delay time in the first and second laser pulses, blur and then disappear entirely in the following laser pulse ablations. These features demonstrate that multi-pulse femtosecond laser ablation is not a simple repeat of single-pulse ablation and produces differences in the ablation results.

The estimated fluence of the femtosecond laser on the aluminum target surface is 5.3 J/cm2, and the power density is approximately 1.06 × 10¹⁴ W/cm2. The fluence on the aluminum target surface is higher than the ablation threshold of aluminum in air (approximately 0.1 J/cm2),[32] and such a power density will induce the ionization of the surface layer atoms of the aluminum target and form plasma.[19,33] The bulge that appears at 200-ps delay time is the plasma generated because of the ionization of the atoms in the aluminum target’s surface layers, induced by the high-intensity laser energy deposited at the surface of the target. At the 200-ps delay time, the plasma bulge is opaque, as shown by Fig. 2(a-1), because the electron number density in the plasma is great and the plasma frequency is higher than the frequency of the probe beam, such that the probe beam cannot travel through the plasma. At later delay times, the energetic plasma expands and pushes the ambient air to form the shock wave.[30,31] The electron number density and the frequency of the plasma decrease with the expansion of the energetic plasma, and the plasma gradually becomes transparent as expansion continues after 2 ns, as shown in Fig. 2.

The plasma of the shock wave becomes transparent after 3 ns, and the ejected material can be clearly observed within the shock wave front after 3 ns, as shown in Fig. 2. The ejected material absorbs and scatters the probe beam, as represented by the dark areas in the shadowgraphs. In the shadowgraphs, for instance in Fig. 2(f-1), the gray scale of the dark area formed by the ejected material is close to the gray scale of the target. The shadowgraph at the 5-ns delay time shows the size, gray scale, and shape of the dark area formed by the ejected material, presenting the spatial distribution and the amount of ejected material with each laser pulse. In Fig. 2, it can be seen that the ejected material induced by the second laser pulse looks denser than that by the first laser pulse, and the size of the dark area formed by the ejected material in Fig. 2(f-2) is larger than that in Fig. 2(f-1), indicating that the amount of ejected material induced by the second laser pulse ablation is more than that ejected by the first laser pulse ablation. The distance covered by the ejected material induced by the second laser ablation is greater than that induced by the first laser ablation, which also indicates that the velocity of the ejected material induced by the second laser is greater than that by the first laser ablation. The estimated velocity of the ejected material induced by the first laser pulse is 5.7 km/s, and the estimated velocity by the second laser pulse is 7.3 km/s, based on Figs. 2(f-1) and 2(f-2). Furthermore, figure 2(f-1) through Fig. 2(f-8) also show that the ejected material induced by the third laser pulse through the eighth laser pulse shows different spatial distributions comparing with the first laser pulse, indicating that the amount of ejected material induced by the third laser pulse through the eighth laser pulse is also different from that induced by the first laser pulse.

The dependence of the radius R of the shock wave front on the propagation time or delay time can be approximately described by the Sedov–Taylor equation[34,35]

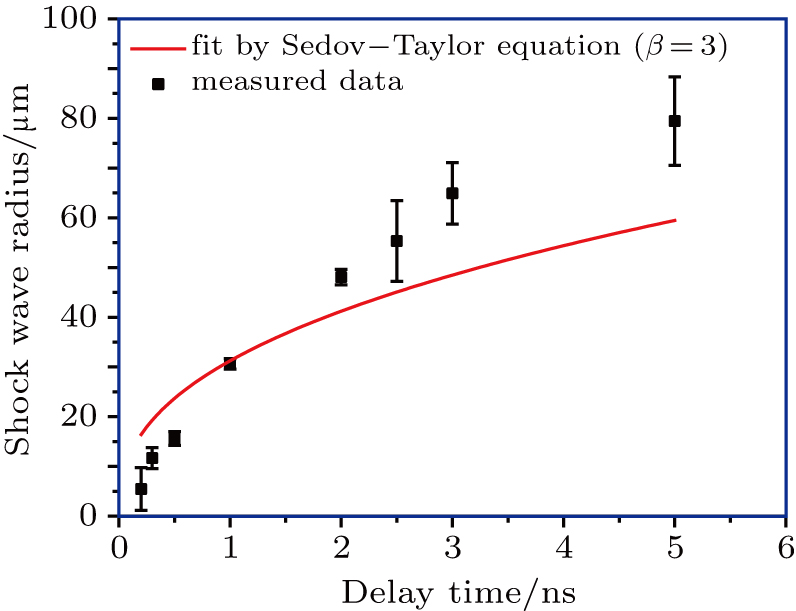
where λ is a dimensionless constant close to unity, E is proportional to the actual energy E that drives the shock wave (E = 2.35E0 for hemispherical symmetry), ρ is the density of the undisturbed air, t is the propagation time of the shock wave or delay time, β is a coefficient related to the dimension of the explosion, and β = 3, 2, and 1 for spherical, cylindrical, and planar shock waves, respectively. The shock wave front radius R is measured along the normal direction of the target surface. Figure 3 shows the curve of the shock wave front radius fitted to the delay time using Eq. (1) with β = 3 for the case of single-laser pulse ablation, based on the recorded shadowgraphs. In Fig. 3, it can be seen that some deviation exists between the measured data and the fitting curve. This may be attributed to the fact that the laser ablation spot is essentially not a real point source.

Fig. 3. (color online) Radius of the shock wave along the normal direction of the target surface as a function of the propagation time after a single 50-fs laser pulse of 0.22 mJ strikes the target under 1 atm.

Figure 4 shows the dependence of the shock wave radius on the ordinal of the laser pulse employed to ablate the target for multi-pulse ablation at a certain delay time, based on the shadowgraphs shown in Fig. 2. The radius of the shock wave front clearly decreases over the initial four laser pulses at any given delay time and remains almost unchanged since the fourth laser pulse.

Fig. 4. (color online) Radius of the shock wave along the normal direction of the target surface as a function of the ordinal of 50-fs laser pulses of 0.22 mJ, striking the target under 1 atm, for different delay times.

The air pressure just behind the shock wave front is also estimated with the following equation developed from Sedov’s theory:[34]

where P is the pressure just behind the shock wave front, γ is the heat capacity ratio (γ ≈ 1.4 for air which is predominantly a diatomic gas), ρ is the mass density of the undisturbed air which in our experiment can be calculated using the equation of state for ideal gas according to the measured ambient air pressure and temperature, α is the speed of sound which can be obtained using the equation of , and v is the speed of the shock wave front which can be derived from the displacement data such as those given in Fig. 3.

The calculated air pressure behind the shock wave front at different delay times is shown in Fig. 5. The calculated pressure decreases with the increase of the delay time, and the air pressure behind the shock wave is approximately 1.5 GPa at 200-ps delay time, as shown in Fig. 5.

Fig. 5. Calculated air pressure just behind the shock wave front as a function of delay time under 1 atm.
3.1. Ionization of the target

Changes to the target surface induced by the laser pulses ablation can certainly be expected to be responsible for the differences between multi-pulse ablation and single-pulse ablation. The SEM images in Fig. 6 shows the target surface structures after the target is ablated by 1, 2, 4, and 8 femtosecond pulses, respectively. In the first column of Fig. 6, figures 6(a) and 6(e) show the same ablated spot after one laser pulse ablation, but the magnification ratio of Fig. 6(e) is 1600, while the magnification ratio of Fig. 6(a) is 800. The other columns in Fig. 6 are the same situation of magnification ratio. Some solidified droplets and textures form micro- and nanostructures on the target surface after the first and the second laser pulse ablation, as shown in Figs. 6(e) and 6(f). The micro- and nanostructures increase the surface area of the ablated region and result in the intensity drop of the incident laser when the subsequent laser pulses irradiate the target surface. The intensity drop of the incident laser for the subsequent laser pulses leads to the attenuation of the target ionization, and the radius of the shock wave decreases with the increase of the laser pulse ordinal.

Fig. 6. (color online) SEM images of the four ablated regions on the target surface after ablation by (a), (e) 1, (b), (f) 2, (c), (g) 4, and (d), (h) 8 femtosecond laser pulses, respectively. The magnification ratios of the pictures in the first and second rows are 800 and 1600, respectively. The size of the pictures in the first and second rows are 156.8 μm×117.6 μm and 78.4 μm ×58.8 μm, respectively.

At the same time, the preceding laser pulse ablation will also generate some aluminum oxide film of high transmittance on the target surface. As a result, the more energy of the subsequent laser pulse deposits in the interior of the target and the intensity deposited at the surface layer decreases, which results in the weakness of the ionization of the surface layer atoms. The material under the film of high transmittance can be ionized by the incident laser pulse. However, the film of high transmittance becomes an obstruction and attenuates the expansion of the plasma generated by the ionization of the material under the film of high transmittance, which results in the decrease of the energy driving the shock wave, and therefore the radius of the shockwave front decreases with the increase in the ablation laser pulse ordinal.

The less energy drives the shock wave, the smaller the radius of the shock wave is at any given delay time. Before the fourth laser pulse, the change to the target surface structure is significant, as shown in Fig. 6. Therefore, the ionization induced by the laser pulse weakens significantly, and the radius of the shock wave front also decreases with the increased laser pulse ordinal until the fourth laser pulse, as presented in Fig. 4. However, from the fourth laser pulse to the eighth laser pulse, the change to the ablated target surface structure is not sufficient to affect and vary the ionization of the aluminum target, and the energy deposited in the plasma is almost unchanged. Thus the size of the plasma and the radius of the shock wave remain almost unchanged beginning with the fourth laser pulse, as shown in Fig. 4.

3.2. Material ejection

When the femtosecond laser irradiates the aluminum target, the intensity of the laser deposited at a given depth in the aluminum target follows the Beer–Lambert law that the intensity decreases with increasing penetration depth. Therefore, the atoms in the depth of the aluminum target cannot ionize directly in the manner of the target’s surface layer atoms because of the decreased laser intensity. The deposition of the laser pulse energy in the depth of the aluminum target generates the ejected material indicated by E in Fig. 2(f-1), and some theories have been brought forward to explain the material ejection, such as phase explosion,[16] critical point phase separation,[17] Coulomb explosion,[18] fragmentation,[19] and thermoelastic waves.[20]

Figure 6(e) shows that some micro- and nanostructures emerge on the target surface after the first laser pulse ablation. Solidified aluminum droplets are observed and the aluminum in the ablation region melts and solidifies, as shown in Fig. 6, which also demonstrates the thermal effect in the process of the laser ablation in our experiments.

Previous works have reported that the optical absorption of the metal surface was enhanced by the micro- and nanostructures induced by the femtosecond laser.[3638] The ablation induced by the preceding pulse generates micro- and nano-structures on the target surface, leading to more laser energy absorbed by the target for the second laser ablation. The enhanced absorption provided by these surface structures facilitates increased energy transfer to the aluminum lattice during the second femtosecond laser ablation, increasing the amount and velocity of ejected material.

It is also reported that the high pressure of the shock wave induces residual stress in the materials after the material is treated by the laser shock processing.[3941] In our experiment, the estimated plasma pressure of shock wave is 1.52 GPa at 200-ps delay time, as shown in Fig. 5. Such a high pressure will induce residual stress in the aluminum target. The release of the residual stress in the laser ablation should also increase the amount and velocity of the ejected material for the second laser ablation.

The target surface structure continues to change with the each subsequent laser pulse. The surface structure of the aluminum target after the fourth or the eighth pulses ablation are different with that after first or the second laser ablation, resulting in different spatial distributions and the amounts and velocity of material ejected by the pulses. The amount and velocity of the ejected material vary with the increase of the laser pulse ordinal, which should be considered in the process of femtosecond laser machining.

3.3. Nearly concentric and semicircular stripes

In single-pulse ablation, several nearly concentric and semicircular stripes occur at approximately 2-ns delay time, and the stripes blur at 3 ns and disappear entirely at 5 ns, as shown by the first row of Fig. 2, which has been observed in our previous works for the case of single-laser pulse ablation.[2931] According to our previous research, the nearly concentric and semicircular stripes result from the diffraction or absorption of the probe beam through the shock wave region. The air pressure behind the shock wave front decreases with increased delay time, and the pressure distribution of the air within the shock wave front affects this region’s refractive index distribution. At the same time, the ion number densities of the plasma and the ejected material evolve with increased delay time, which also affects the refractive index distribution within the shock wave front. In the region within the shock wave front, the air pressure distribution, the plasma, and the ejected material jointly form a time-varying refractive index distribution or absorption field. The refractive index distribution or absorption field within the shock wave front achieves a special state at approximately 2 ns, by the diffraction or periodic absorption to the probe beam. The periodic nearly concentric and semicircular stripes emerge within the shock wave front when the probe beam passes through the region within the shock wave front at approximately 2 ns. At a longer delay time, such as 5 ns, the refractive index distribution or absorption field within the shock wave front varies and differs from that at 2 ns, and no longer forms the stripes.

In Figs. 2(d-1) to 2(d-8), it can be seen that the nearly concentric and semicircular stripes emerge within the shock wave front at 2 ns for both the first and second laser pulses, whereas the stripes blur for the third laser pulse and disappear from the fourth laser pulse through the eighth laser pulse. Figure 4 indicates that the radius of the shock wave front induced by the first and second laser pulses is larger than that induced by the third through eighth laser pulses. The variation in the shock wave front radius indicates the variation in the air pressure distribution within the shock wave front with the increasing laser pulse ordinal, and thus the refractive index distribution within the shock wave front also varies with the increasing laser pulse ordinal. Furthermore, the states of the plasma and the ejected material also vary with the increasing laser pulse ordinal because of the changes to the surface structure of the aluminum target, further impacting the refractive index distribution or absorption field, which is responsible for the blur and disappearance of the nearly concentric and semicircular diffraction stripes.

4. Conclusion

The dynamic evolution process of aluminum ablation by successive femtosecond laser pulses is investigated using time-resolved shadowgraphs based on the pump–probe technique, as well as morphology analyses using SEM images. The spatial distribution of the ejected material varies with increasing numbers of incident laser pulses. The area and distance covered by the ejected material in the interior of the shock wave by the second pulse are larger than that ejected by the first pulse in shadowgraphs, indicating that more and higher speed material is ejected by the second pulse than by the first pulse. The radius of the induced shock wave decreases over the initial four laser pulses, and then remains almost unchanged after the fourth laser pulse. Nearly concentric and semicircular stripes are observed within the shock wave front for the first and second pulses in shadowgraphs, and the stripes blur for the third pulse and disappear from the fourth through the eighth pulses. The SEM images show that the ablated regions of the aluminum target surface melt and solidify after the irradiation of the femtosecond laser pulse. Some droplets are observed on the target surface in the SEM images. These demonstrate the occurrence of thermal effect in the process of the laser ablation in our experiments. Some micro- and nano-structures are also observed on the target surface after laser pulse ablation. Ablation by multiple femtosecond laser pulses differs from ablation by the single femtosecond laser pulse, and the differences are attributed to the changes to the surface structure of the aluminum target induced by the preceding multiple pulses. The results reveal the characteristics of the multiple femtosecond laser pulses ablation and may offer some guidance on the femtosecond laser material processing.

Reference
[1] Kamata M Obara M Gattass R R Cerami L R Mazur E 2005 Appl. Phys. Lett. 87 051106
[2] Fletcher L B Witcher J J Troy N Reis S T Brow R K Krol D M 2011 Opt. Express 19 7929
[3] Zhao Q C Dai Y T Li T Liu B Yang M H Yin G L 2014 Opt. Lett. 39 1905
[4] Gao B Hou X Chen Y Si J H 2015 Chin. Phys. Lett. 32 107901
[5] Khuat V Ma Y C Si J H Chen T Chen F Hou X 2014 Chin. Phys. Lett. 31 037901
[6] Nivas J J Anoop K K Bruzzese R Philip R Amoruso S 2018 Appl. Phys. Lett. 112 121601
[7] Gao S Wang Z G Hua J G Li Q K Li A W Yu Y H 2017 Acta Phys. Sin. 66 147901 in Chinese
[8] Zhao K Feng L H Wang Q Q Liu M Z Wang B G Cui F Sun Y N 2013 Chin. Phys. 22 117901
[9] Mahmood A S Sivakumar M Venkatakrishnan K Tan B 2009 Appl. Phys. Lett. 95 034107
[10] Kim D Jang W Kim T Moon A Lim K Lee M Sohn I Jeong S 2012 J. Appl. Phys. 111 093518
[11] Yin K Du H F Dong X R Wang C Duan J A He J 2017 Nanoscale 9 14620
[12] Yin K Chu D K Dong X R Wang C Duan J A He J 2017 Nanoscale 9 14229
[13] Semaltianos N G Perrie W Vishnyakov V Murray R Williams C J Edwardson S P Dearden G French P Sharp M Logothetidis S Watkins K G 2008 Mater. Lett. 62 2165
[14] Kuzmin P G Shafeev G A Bukin V V Garnov S V Farcau C Carles R Warot-Fontrose B Guieu V Viau G 2010 J. Phys. Chem. 114 15266
[15] Halimah M K Mahmoud G N Amir R S Arash D Ahmad K Elias B S Reza Z Hossein A A Burhanuddin Y M 2014 Chin. Phys. Lett. 31 077803
[16] Lorazo P Lewis L J Meunier M 2003 Phys. Rev. Lett. 91 225502
[17] Vidal F Johnston T W Laville S Barthélemy O Chaker M Le Drogoff B Margot J Sabsabi M 2001 Phys. Rev. Lett. 86 2573
[18] Roeterdink W G Juurlink L B F Vaughan O P H Dura Diez J Bonn M Kleyn A W 2003 Appl. Phys. Lett. 82 4190
[19] Perez D Lewis L J 2002 Phys. Rev. Lett. 89 255504
[20] Wang X W Xu X F 2002 J. Therm. Stresses 25 457
[21] Mannion P T Magee J Coyne E O’Connor G M Glynn T J 2004 Appl. Surf. Sci. 233 275
[22] McDaniel C Flanagan A O’Connor G M 2014 Appl. Surf. Sci. 295 1
[23] Vorobyev A Y Guo C L 2006 Opt. Express 14 2164
[24] Fang R R Vorobyev A Guo C L 2017 Light-Sci. Appl. 6 e16256
[25] Miyaji G Miyazaki K 2016 Opt. Express 24 4648
[26] Hu H F Wang X L Guo W G Zhai H C Wang P 2011 Acta Phys. Sin. 60 017901 in Chinese
[27] Hu H F Wang X L Zhai H C Zhang N Zhai H C 2009 Acta Phys. Sin. 58 7662 in Chinese
[28] Hu H F Liu T G Zhai H C 2015 Opt. Express 23 628
[29] Zhang N Zhu X N Yang J J Wang X L Wang M W 2007 Phys. Rev. Lett. 99 167602
[30] Wu ZH Zhu XN Zhang N 2011 J. Appl. Phys. 109 053113
[31] Wu Z H Zhang N Wang M W Zhu X N 2011 Chin. Opt. Lett. 9 093201
[32] Harzic R L Breitling D Weikert M Sommer S Föhl C Valette S Donnet C Audouard E Dausinger F 2005 Appl. Surf. Sci. 249 322
[33] Hu W Shin Y C King G 2011 Phys. Plasmas 18 093302
[34] Sedov L I 1993 Similarity Dimensional Methods Mech. 10 Boca Raton CRC Press 261 264
[35] Márton Z Heszler P Mechler A Hopp B Kantor Z Bor Z 1999 Appl. Phys. 69 S133
[36] Paivasaari K Kaakkunen J J Kuittinen M Jaaskelainen T 2007 Opt. Express 15 13838
[37] Vorobyev A Y Guo C 2007 Appl. Phys. 86 321
[38] Ahsan M S Lee M S 2013 Optik 124 3631
[39] Fair B P Wilcox B A Gallagher W J Williams D N 1972 J. Appl. Phys. 43 3893
[40] Fabbro R Peyre P Berthe L Scherpereel X 1998 J. Laser Appl. 10 265
[41] Dai F Z Lu J Z Zhang Y K Wen D P Ren X D Zhou J Z 2014 Appl. Surf. Sci. 316 477