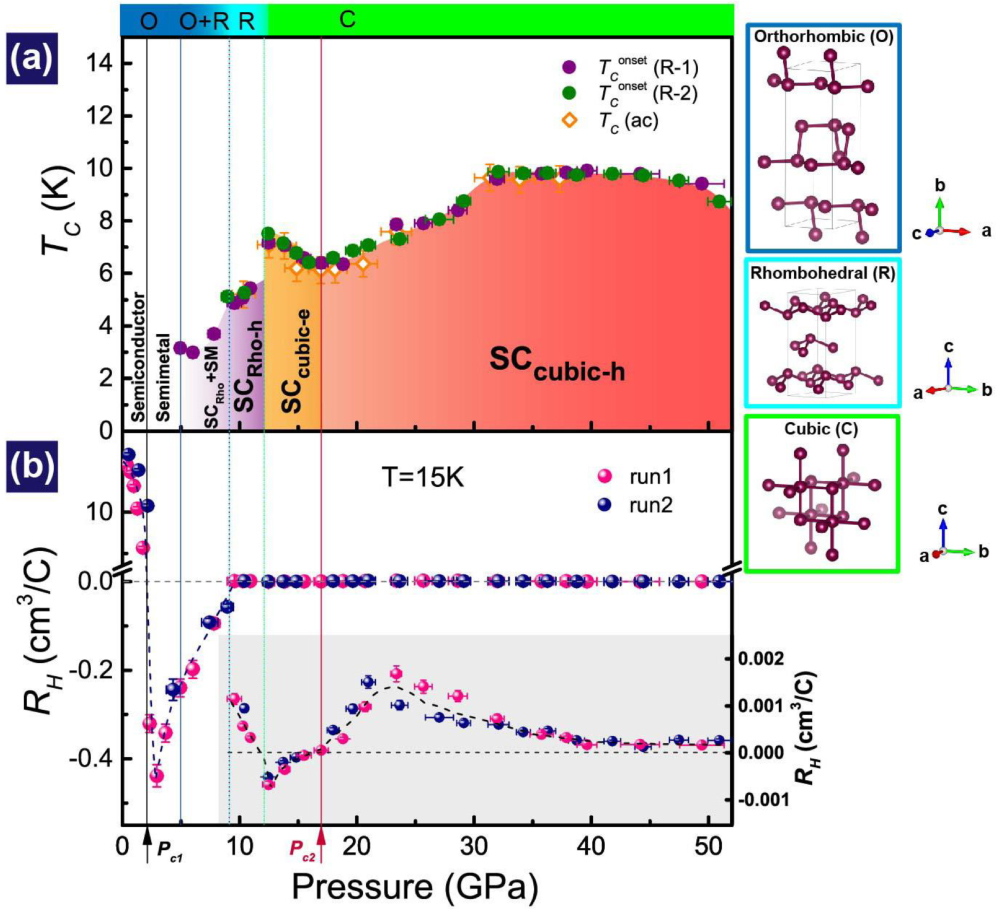
(color online) Structural, superconducting, and Hall coefficient (RH) phase diagram of black phosphorus at different pressures. (a) Pressure–temperature phase diagram combined with structural phase information. Here SM and SCRho-h represent semimetal and superconducting phases with rhombohedral structures and dominant hole carriers, respectively. SCcubic-e and SCcubic-h stand for the superconducting phase with cubic structure and dominance of electron carriers and hole carriers, respectively.
TConset
(R-1) and
TConset
(R-2) represent the onset temperature of superconducting transitions determined from resistance measurements for run 1 and run 2. TC(ac) represents the superconducting transition temperature determined by ac susceptibility measurements. (b) Pressure dependent RH measured at 15 K. The inset displays the detailed changes in RH at the structural phase-transition boundaries. The pink and blue solid points represent Hall coefficients obtained from two independent runs. Pc1 and Pc2 stand for the critical pressures of the Lifshitz transitions. Reproduced with permission from Ref. [113]. |

