† Corresponding author. E-mail:
Project support by the National Key R&D Program of China (Grant Nos. 2017YFB0701501, 2017YFB0701502, and 2017YFB0701503).
Using high-throughput first-principles calculations, we systematically studied the synergistic effect of alloying two elements (Al and 28 kinds of 3d, 4d, and 5d transition metals) on the elastic constants and elastic moduli of γ-Ni. We used machine learning to theoretically predict the relationship between alloying concentration and mechanical properties, giving the binding energy between the two elements. We found that the ternary alloying elements strengthened the γ phase in the order of Re > Ir > W > Ru > Cr > Mo > Pt > Ta > Co. There is a quadratic parabolic relationship between the number of d shell electrons in the alloying element and the bulk modulus, and the maximum bulk modulus appears when the d shell is half full. We found a linear relationship between bulk modulus and alloying concentration over a certain alloying range. Using linear regression, we found the linear fit concentration coefficient of 29 elements. Using machine learning to theoretically predict the bulk modulus and lattice constants of Ni32XY, we predicted values close to the calculated results, with a regression parameter of R2 = 0.99626. Compared with pure Ni, the alloyed Ni has higher bulk modulus B, G, E, C11, and C44, but equal C12. The alloying strengthening in some of these systems is closely tied to the binding of elements, indicating that the binding energy of the alloy is a way to assess its elastic properties.
Ni-based single-crystal (SC) superalloys are widely used in turbine blades in aircraft jet engines and land-based power generators because they have excellent high-temperature properties, including strength, ductility, fracture toughness, and fatigue resistance, as well as enhanced creep and oxidation resistance.[1] To increase their lifetime and service temperature, Ni-based superalloys are often alloyed with ten or more elements, making them some of the most complex alloys.
The elastic moduli of a material can be used to assess its mechanical properties such as ductility and brittleness, hardness, and strength. The bulk modulus (B) represents a material’s average resistance to bond breakage, and its shear modulus (G) is closely linked to its resistance to plastic deformation. Furthermore, the B/G ratio of a metal is related to its ductility, as proposed by Pugh:[2] a material with a large B/G ratio (> 1.75) will show ductile behavior, while one with a low B/G ratio (< 1.75) will show brittle behavior. To understand and develop next-generation Ni-based superalloys, we must systematically study their fundamental properties and show how alloying elements affect their mechanical properties.
In this paper, we study how alloying transition metals from three periods, i.e., 3d (Sc, Ti, V, Cr, Mn, Fe, Co, Ni, Cu, Zn), 4d (Y, Zr, Nb, Mo, Tc, Ru, Rh, Pd, Ag, Cd), and 5d (Hf, Ta, W, Re, Os, Ir, Pt, Au), affect the elastic properties in Ni dilute solid solutions, using first-principles calculations with the efficient stress–strain method.
We performed ab initio total-energy calculations with Vienna ab initio simulation package (VASP) code[3–6] based on density functional theory. The pseudo-potentials used to describe the interactions between nuclear and extranuclear electrons were obtained using the projector augmented wave (PAW) method.[7] The electronic exchange–correlation energy was treated within the generalized gradient approximation (GGA) with the Perdew–Burke–Ernzerhof functional.[8] The plane wave kinetic energy cut-off was set to 350 eV to ensure total energy convergence to 10−5 eV and force convergence to −0.02 eV/Å. The integration over the Brillouin zone (BZ) was done using a Monkhorst–Pack grid.[9] For accurate calculations of total energy, we used a 11 × 11 × 11 k-point sampling grid for 32-atom supercells and a 5 × 5 × 5 k-point sampling grid for 108-atom supercells.
The elastic behavior of a completely asymmetric material is specified by 21 independent elastic constants, while that of an isotropic material is specified by 2. Between these limits, the number of constants depends on the symmetry of the material.
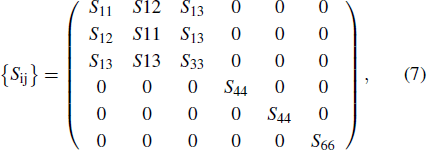
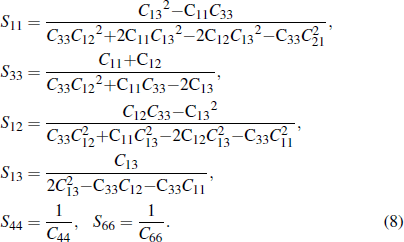
For the tetragonal structure a = b ≠ c, α = β = γ = 90°, C11 = C22, C13 = C23, and C44 = C55. Tetragonal crystals require 6 constants, usually referred to as C11, C33, C44, C66, C12, and C13, as shown in Eq. (
Elastic constants are defined by a Taylor expansion of the total energy E(V,e). For a small strain
 |
 |
| Table 1. Components of the strain tensor for a tetragonal system [u = (1−δ2)−1/2]. . |
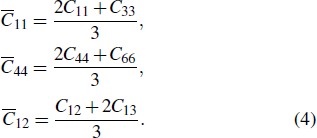
Because cubic symmetry is disrupted by alloying atoms, we estimated the average elastic constants for each configuration as
 |
 |
 |
 |
 |
Using energy considerations, Hill[12] proved that the Voigt and Reuss equations represent the upper and lower limits of the true polycrystalline constants, and recommended that practical estimates of the bulk and shear moduli are the arithmetic means of these extremes. Hence, the elastic moduli of a polycrystalline material can be approximated by Hill’s average, which for shear moduli is
 |
 |
| Table 2. Elastic constants and moduli of the Ni31X system. . |
Table
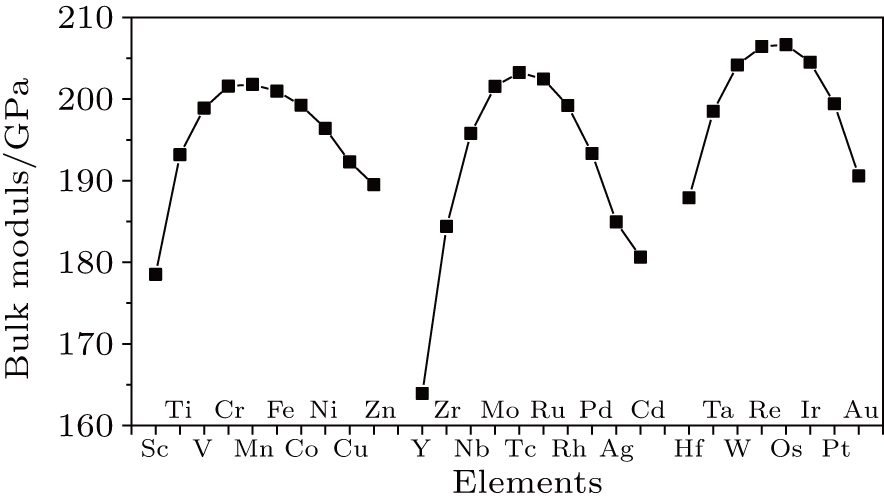
The bulk modulus of an alloy is related to the number of d electrons of the alloying element. Figure
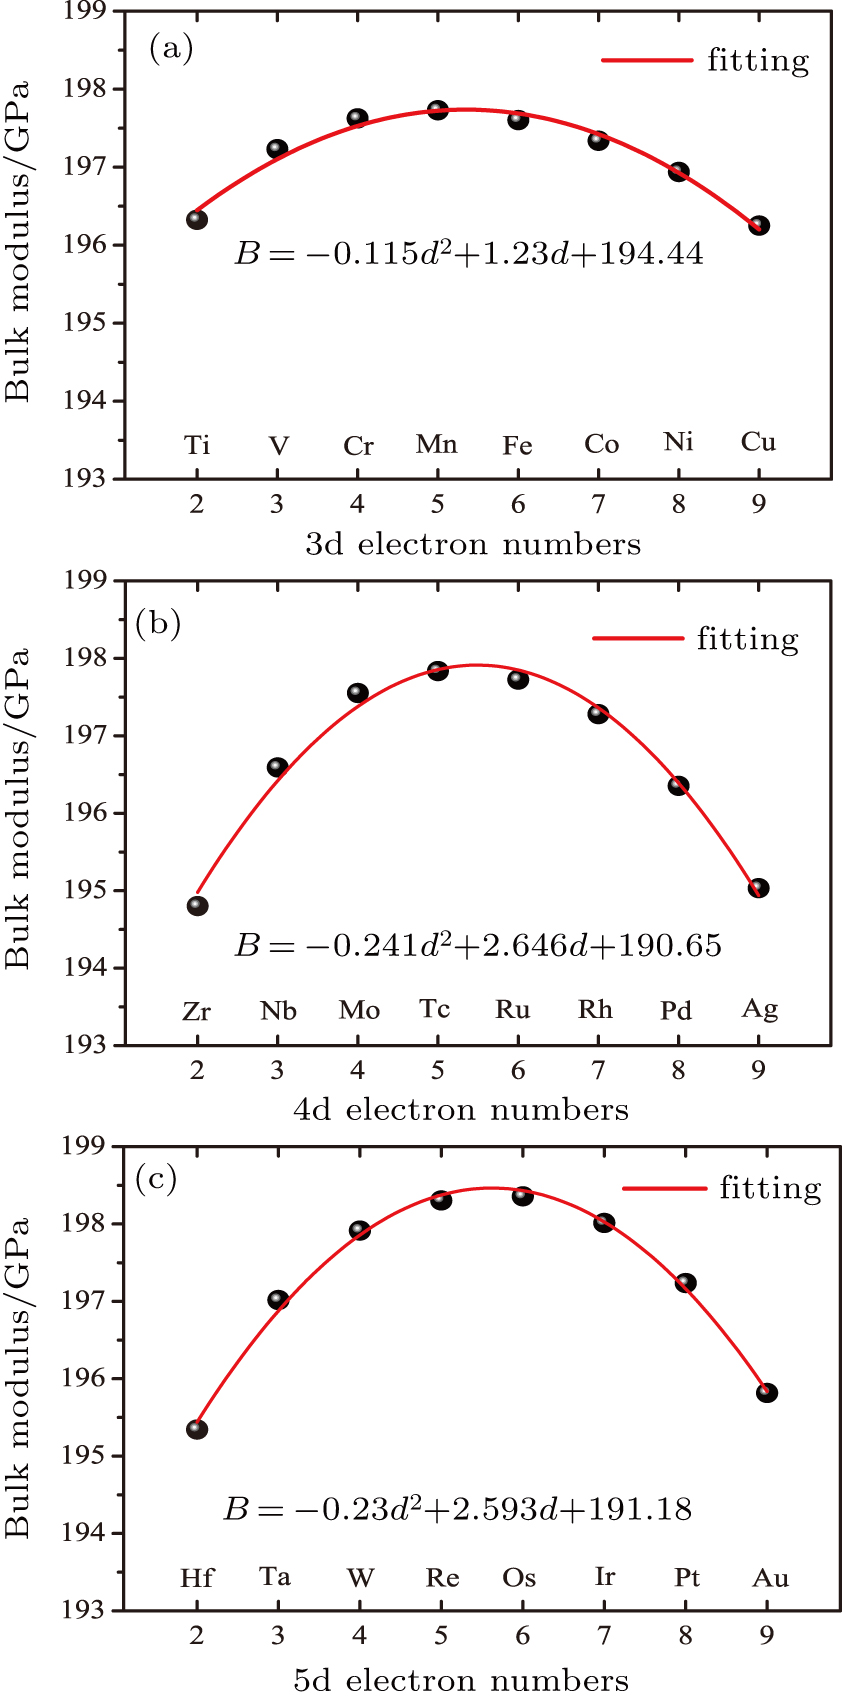 | Fig. 1. (color online) Bulk modulus as a fitting function of d electrons for the 3d, 4d and 5d group transition metal elements in the Ni107X systems. |
In order to explore the relationship between the doping concentration and mechanical properties of the materials, we calculated the bulk modulus of Ni alloyed with 29 elements at concentrations of 0.926%, and 3.125%, corresponding respectively to Ni107X and Ni31X models. The calculated result is shown in Fig.
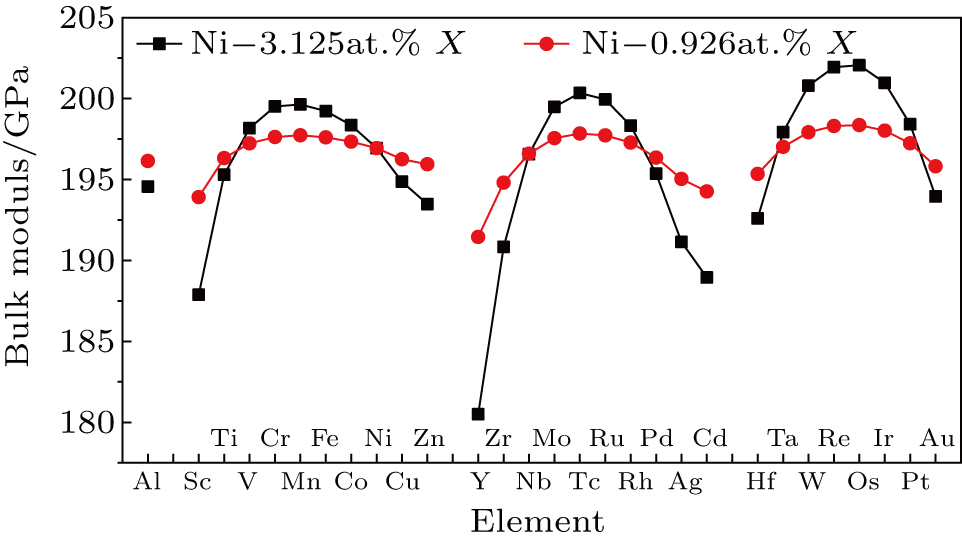 | Fig. 2. (color online) Influence of alloying elements on bulk modulus at various concentrations, showing the Ni107X systems with red dots and the Ni31X systems with black dots. |
From Fig. 
 |


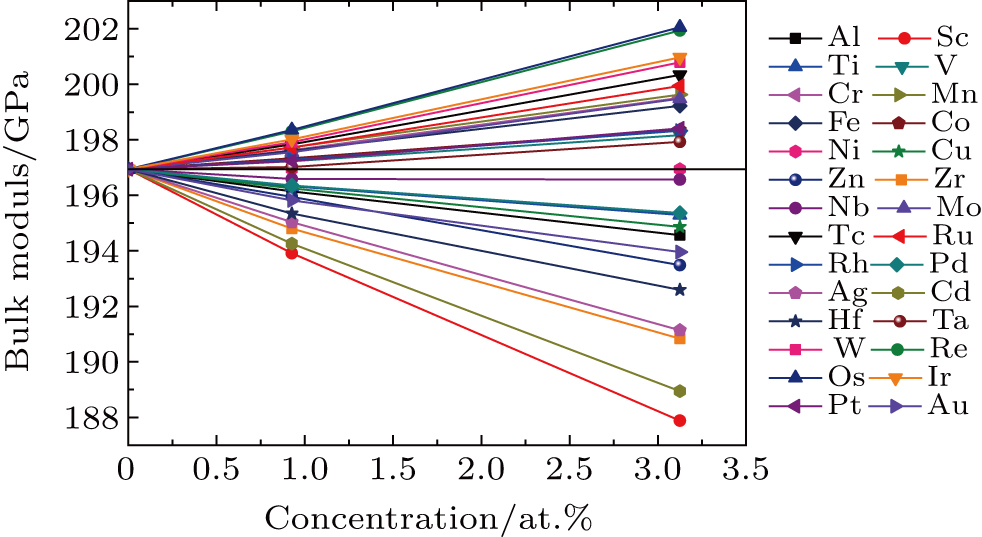 | Fig. 3. (color online) The bulk modulus of Ni alloyed with 29 elements at concentrations of 0%, 0.926%, and 3.125%, corresponding respectively to pure Ni, Ni107X, and Ni31X. |
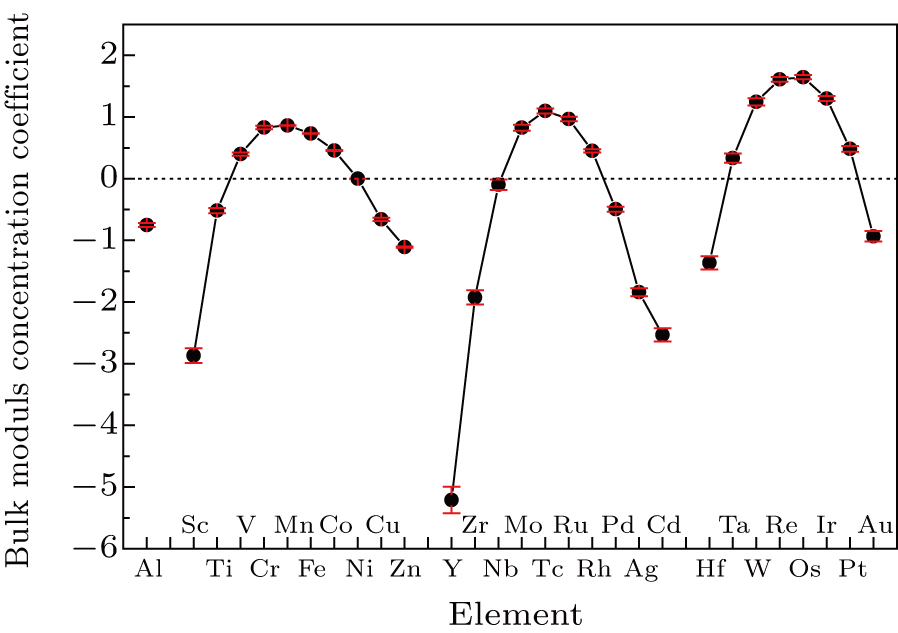
The bulk modulus concentration coefficient can describe how the bulk modulus depends on various alloying concentrations. Figure
Based on these results, Re, W, Ru, Cr, Mo, Co, Ir, Pt all strengthen the solid solution, and Re and W show the strongest effects. Based on this discussion, we obtain a concentration coefficient of the bulk modulus that affects the mechanical properties of the alloys. We can use the concentration coefficient to get the bulk modulus at any concentration, which helps greatly in designing the alloy composition. To see whether this law applies to other alloys, such as those Co-based, Al-based, or Mg-based alloys, we will study the deeper physical mechanism in future work.
To explain how adding an alloying element strengthens a system, we must gain detailed and accurate information about how the alloying element affects structural stability. The strength and structural stability of a crystal are closely related to its binding energy. Larger deviation in the absolute value of binding energy from zero indicates greater system stability. The definition of binding energy is
 |

| Table 3. Free atom energy of elements calculated by first principles (eV). . |
Figure
Overall, we did not find a consistent linear relationship between binding energy and bulk modulus, but some of these elements may have an approximately linear relationship, indicating that elements in different parts of the periodic table have different effects on the mechanical properties of their alloys. Various elements affect the system differently in a way related to the electronic structure of the alloying element. The alloying elements can be divided into three groups based on their role.
(i) The elements that form solid solution in the γ phase of the high-temperature alloy, such as Re, Mo, Ru, Co, and Cr, show a negative linear relationship (blue line). W deviates from the blue line and the green line, which may be related to its uniform distribution in two phases. Fe, Cr, Co, and Mn deviate slightly from the blue line, which may be from ignoring spin-induced effects.
(ii) The elements that form γ′ phase (Al, Ta, Nb, and Ti) show a negative linear relationship (green line).
(iii) Hf, Zr, and Sc show a negative linear relationship (yellow line).
Combined with the above discussion, solid solution strengthening elements in the γ phase show that the smaller the binding energy, the larger the bulk modulus, that is, the more stable the system, the better its elastic properties.
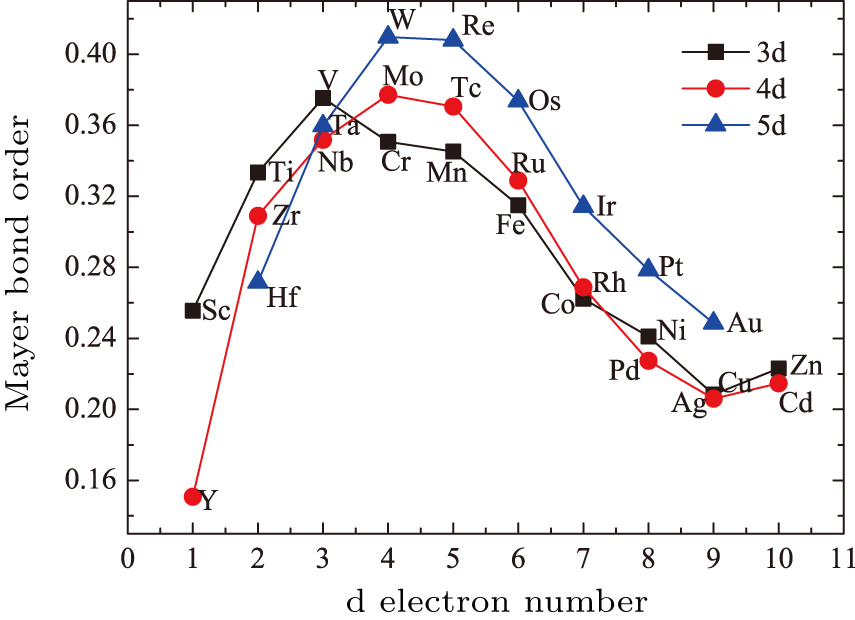
Table
| Table 4. Mayer bond order between alloying elements and Ni in Ni31X. . |
The interaction between the two atoms increases as the bond order increases. In the γ phase, the bond order increases as follows: W > Re > Mo > V > Os > Tc > Ta > Nb > Cr > Mn > Ti > Ru > Fe > Ir > Zr > Pt > Rh > Hf > Co > Sc > Ni > Au > Pd > Zn > Cd > Cu > Ag > Y. This trend is similar to that of the elastic modulus.
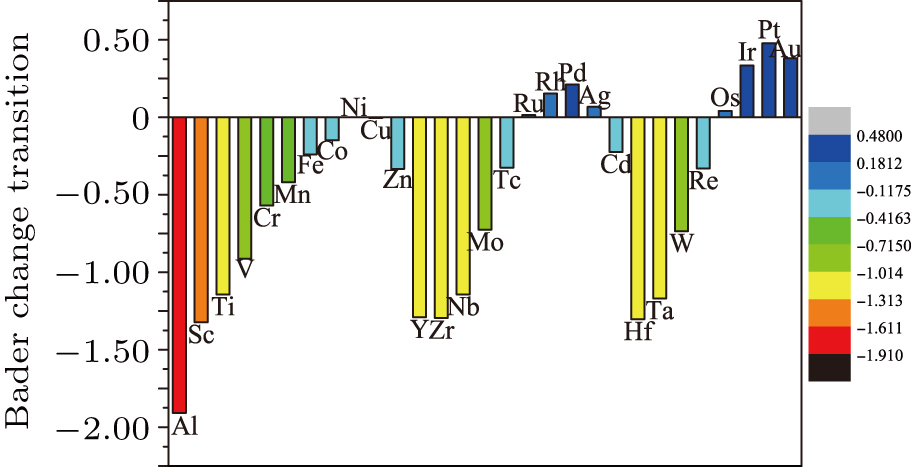
Bader charge analysis[21] was performed for the obtained charge density of Ni31X (X = 3d, 4d, and 5d group elements) alloys, as shown in Table
Figure
| Table 5. Bader charge and Bader charge transfer of alloying elements. . |
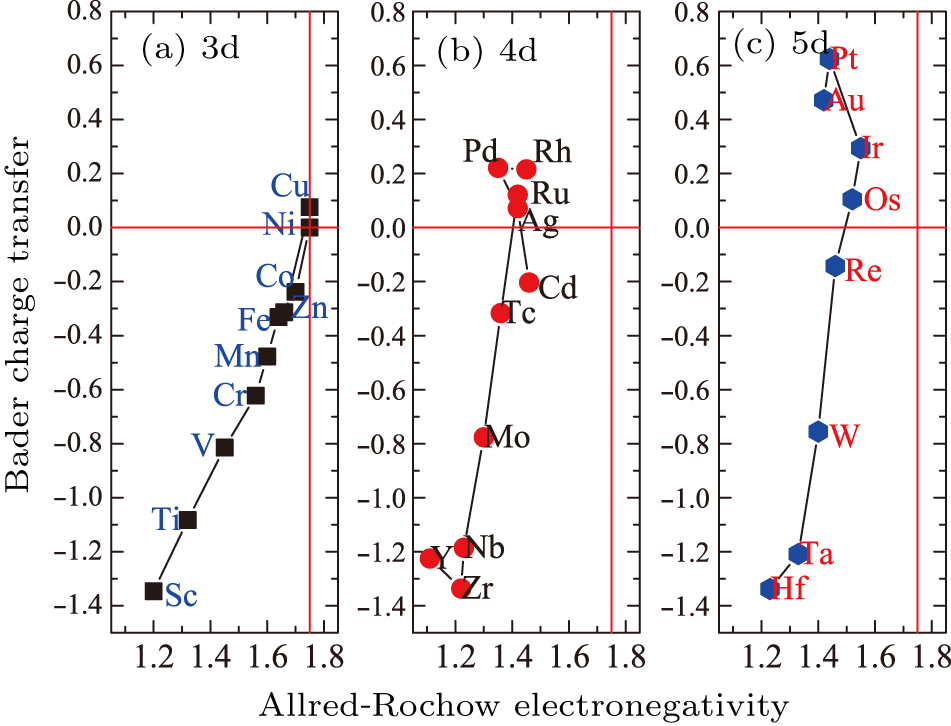
Cr, Co, Nb, Mo, Ru, Ta, W, or Re are the elements usually added to Ni-base superalloys. We have independently studied these elements, revealing a perfect linear relationship between the charge transfer and the number of d electrons within a given period. The 4d elements and 5d elements have consistent slopes, indicating that the transition elements in these two periods have similar interaction mechanisms. For example, Nb is similar to Ta, and Mo is similar to W, as shown in Fig.
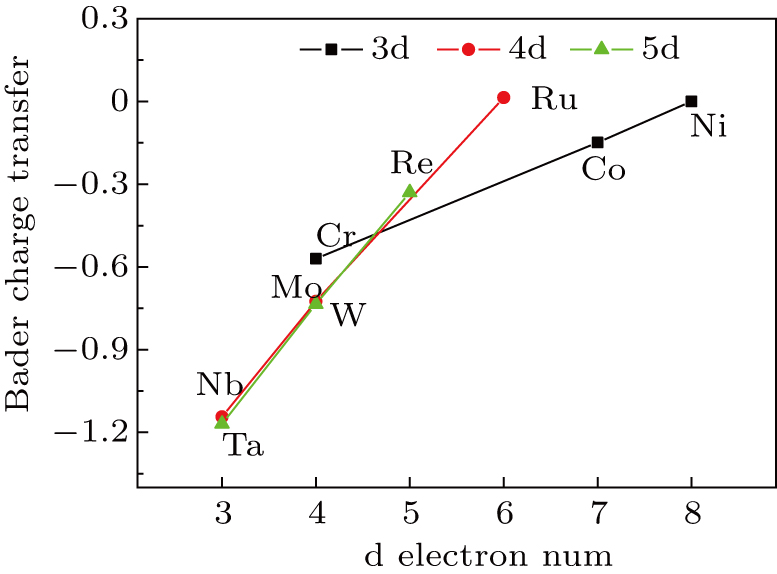 | Fig. 8. (color online) Bader charge of 3d (Cr, Co, Ni), 4d (Nb, Mo, Ru), and 5d (Ta, W, Re) elements. |
The Allred–Rochow electronegativity[22] can be found by taking the electrostatic force exerted by the effective nuclear charge Zeff on the valence electron as follows:
 |
Among Cr, Co, Ni, Nb, Mo, Ru, Ta, W, and Re, there is a positive linear relationship between charge transfer and number of d electrons. We will discuss the mechanism of this relationship in future work.
Figure
Our results show that, by alloying with a single element, more than ten alloying elements produced a high-temperature alloy with excellent performance. This has important implications in studying the synergistic effect of adding multiple elements on the mechanical properties, because it is challenging to describe the mechanical properties of such an alloy using a quantitative method.
Most of the alloying elements in the γ-Ni form a disordered solid solution. Assuming a dilute solid solution, we vary the concentration of the alloying element by varying the size of the unit cell. However, the system cannot be infinite because of first-principles computational constraints, so this method is limited to systems over a set range of concentrations.
The disordered configurations of the atoms in the alloys were considered within the special quasi-random structures (SQS) framework,[23,24] which simulates a random solid solution alloy system by using a special quasi-stochastic structure of binary alloys, rather than by constructing supercells. This framework is the most common and successful special random structure used to calculate semiconductors and transition metal alloys. Figure
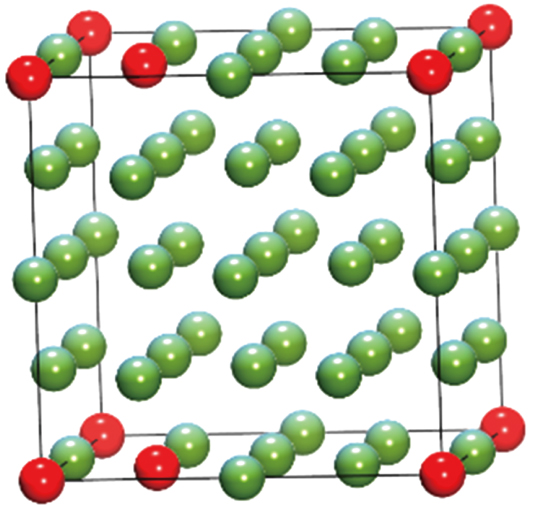 | Fig. 10. (color online) Atomic model of Ni30X2, where green balls represent Ni atoms and red balls represent alloying atoms. |
From Fig.
 |
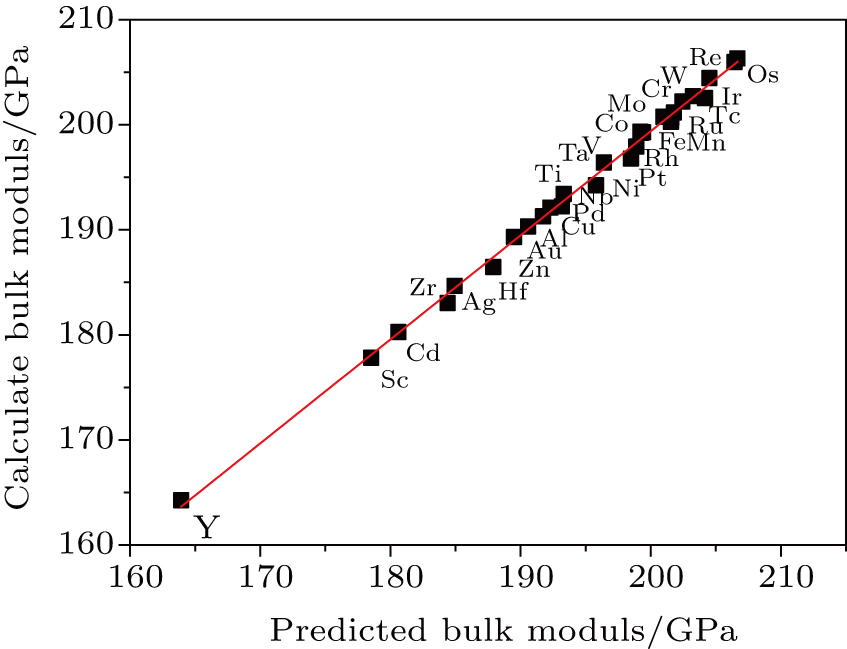 | Fig. 12. (color online) The linear relationship between the predicted lattice constant and the calculated bulk modulus in Ni30X2. |
To further verify our predictions over a wider range of compositions, we studied the Ni30XY ternary alloy, using a model similar to the model of the binary system. In this model, the two elements occupy the first-nearest-neighbor sites. We studied the synergistic effect of the two elements on the elastic properties of Ni alloys, and then verified that our theoretical predictions in the ternary system are reasonable.
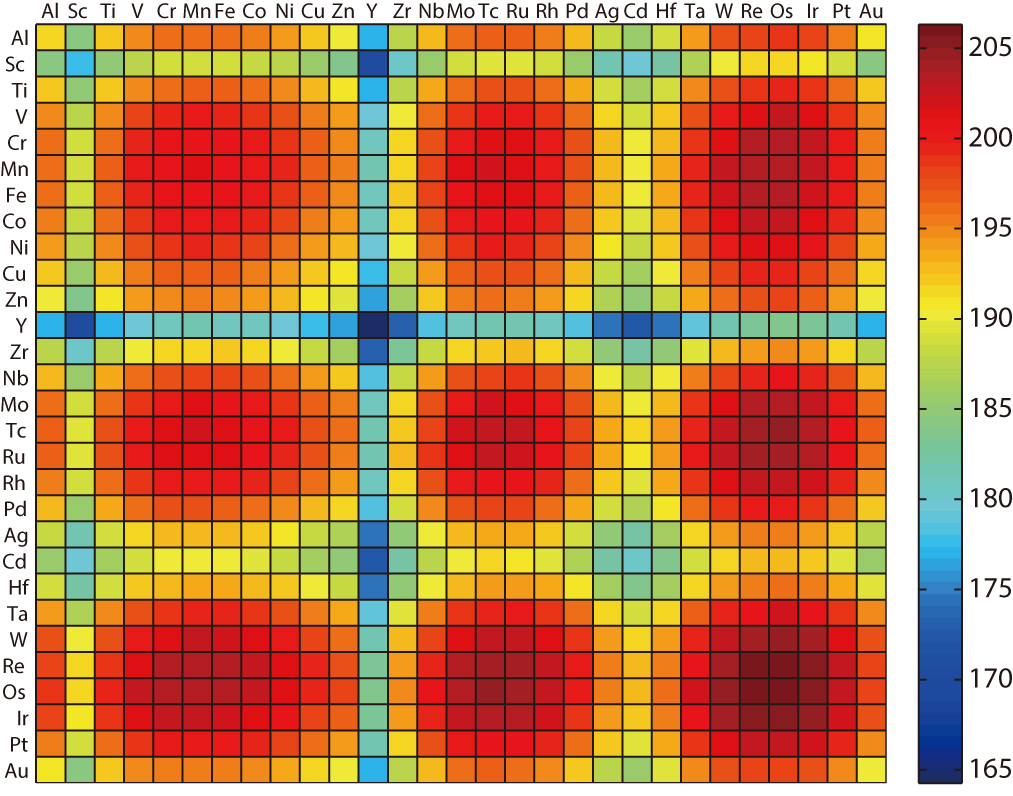
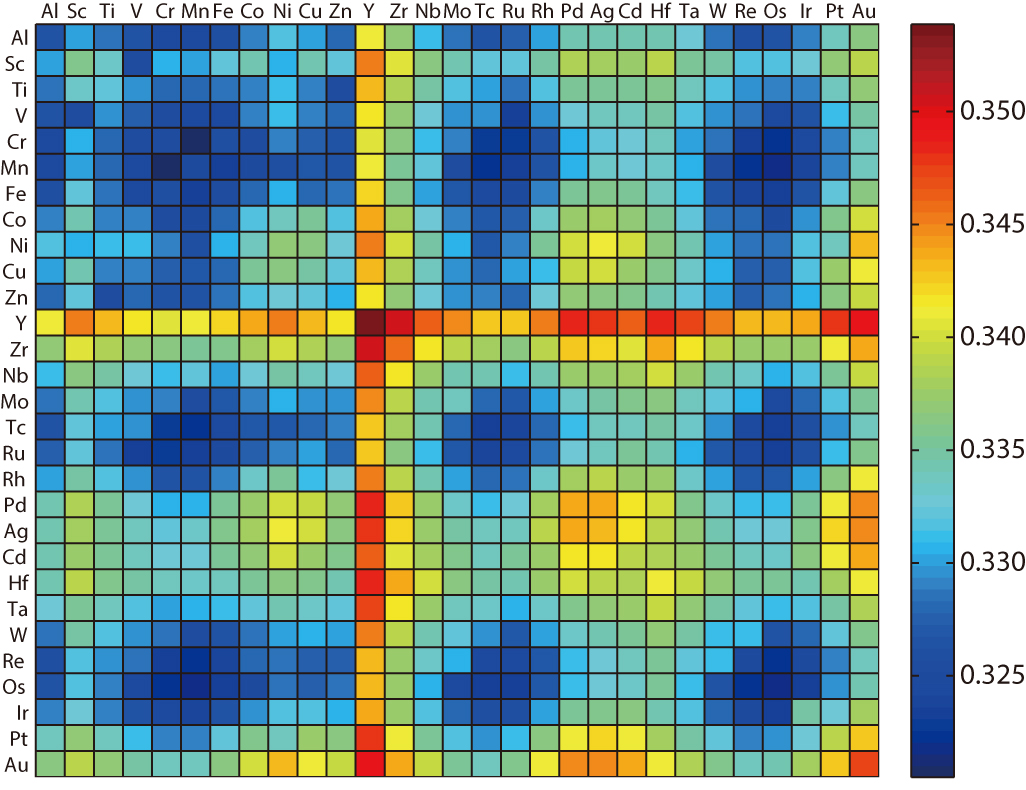
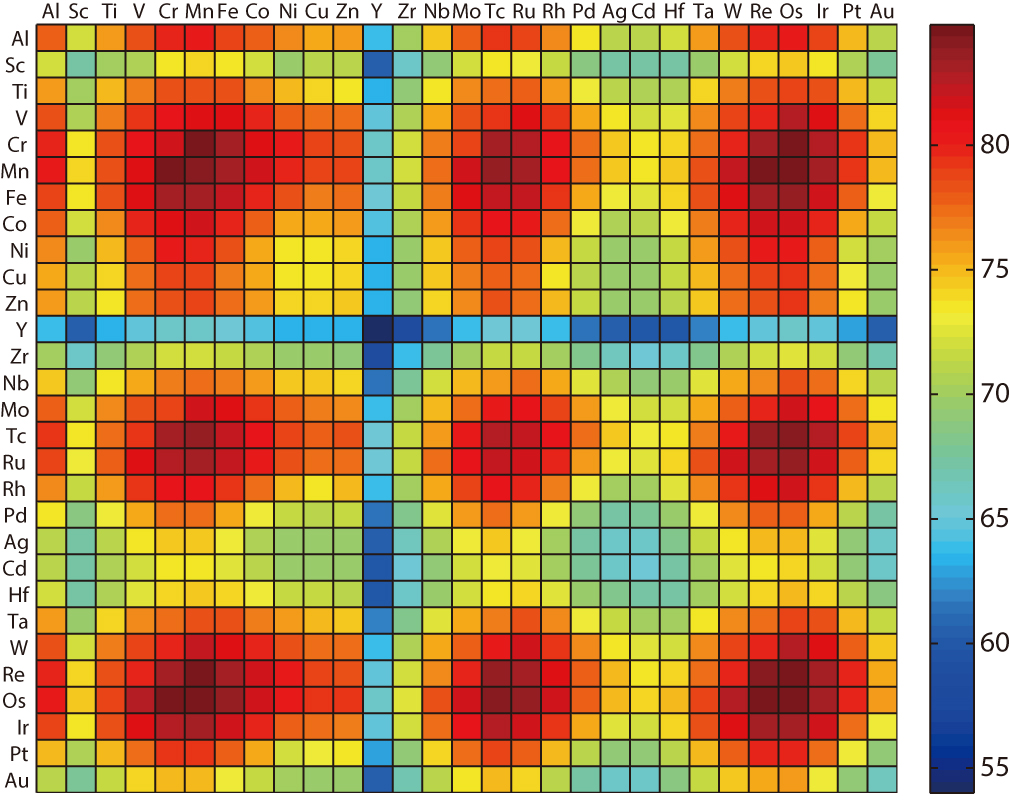
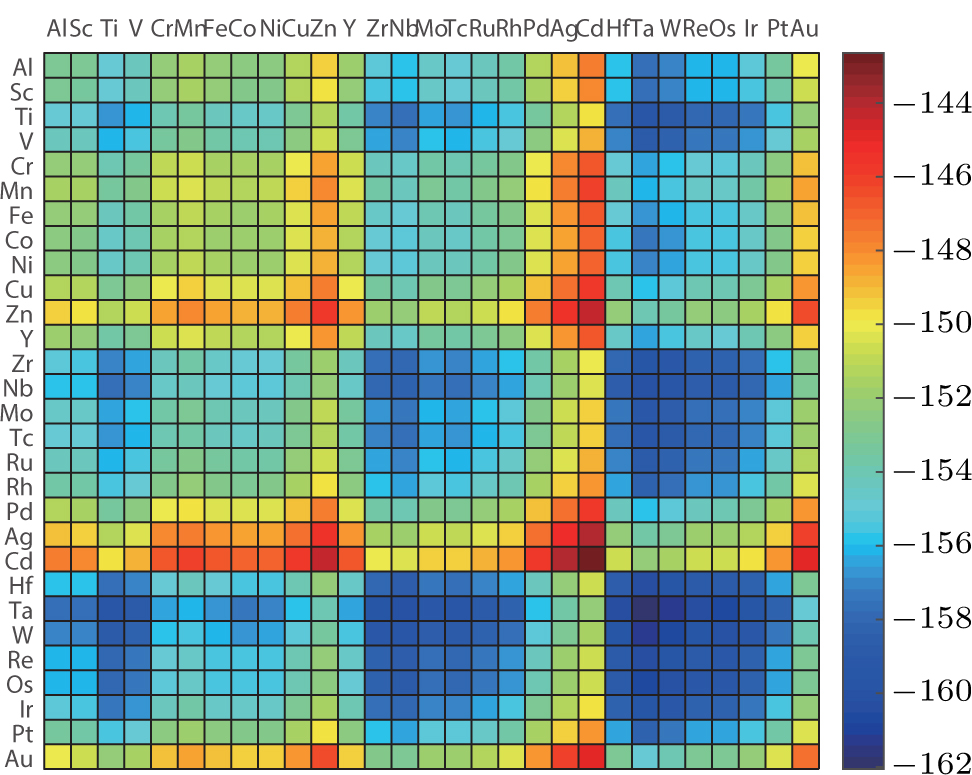
We designed 841 (29×29) models by combining 29 elements. In total, there are 435 inequality systems considering the symmetry (Ni30–X–Y = Ni30–Y–X). These 435 systems contain a combination of binary elements and Ni: Ni30–Ni–X, Ni30–X–X. We used high-throughput job processing to write the relevant procedures, as well as automatic job submission, monitoring, and processing of results. These results are shown in Fig.
The horizontal and vertical axes of Fig.
We predict the bulk modulus of Ni30XY based on the bulk elastic modulus concentration factor obtained earlier, and examine the relationship between the predicted and actual values. The prediction formula is
 |
Figure
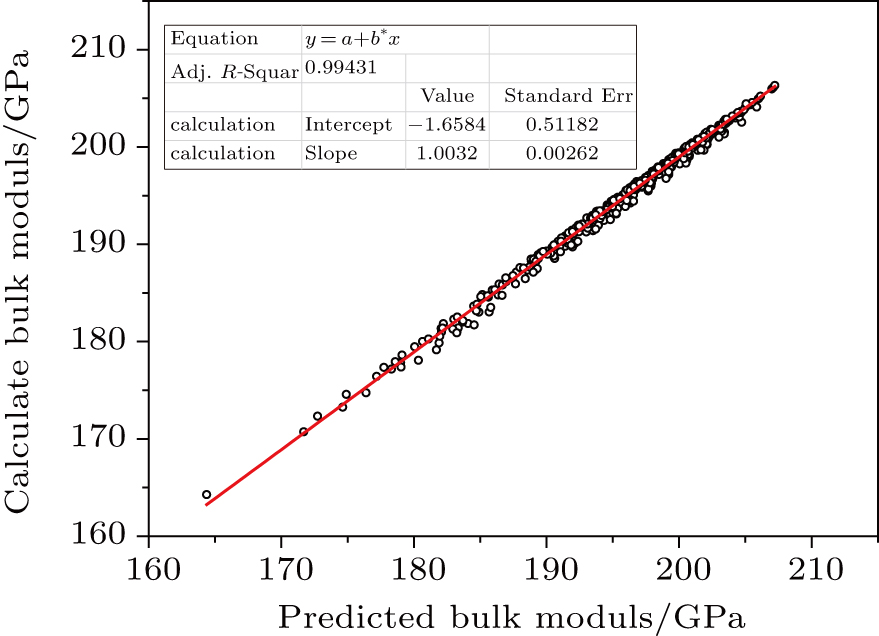 | Fig. 14. (color online) Linear relationship between the predicted and calculated bulk modulus in Ni30–X–Y (X, Y = Al and 28 kinds of 3d, 4d, and 5d elements). |
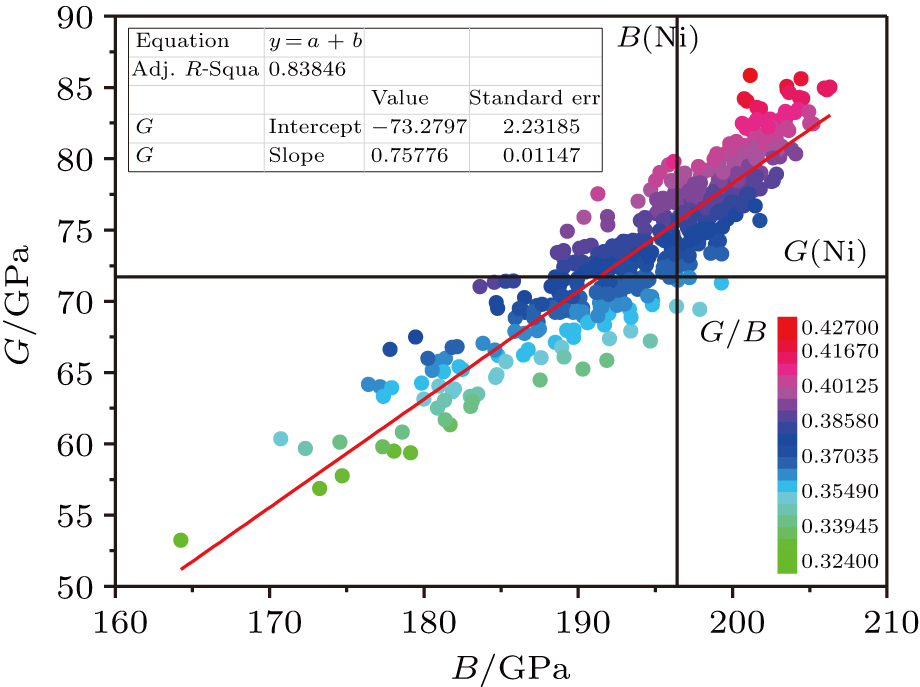
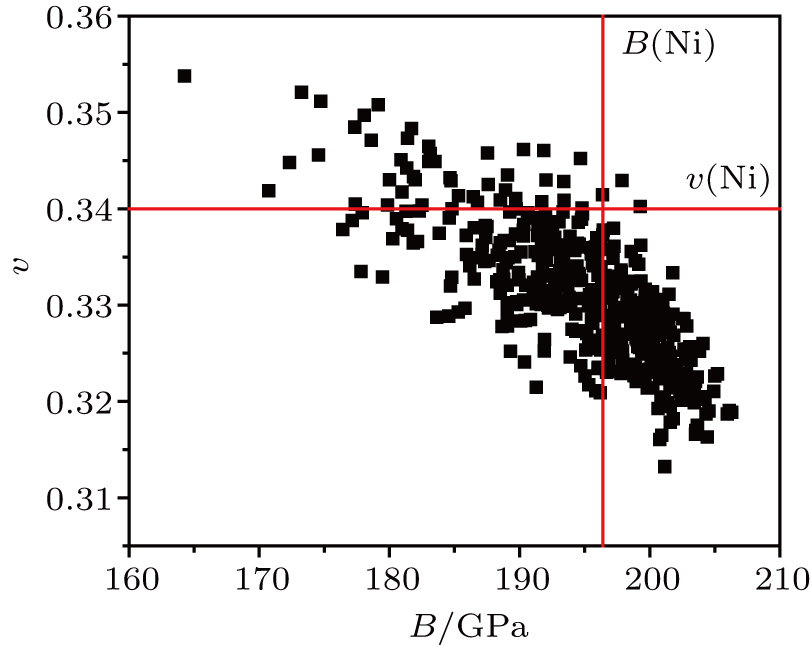
The brittleness or toughness of a compound can be predicted by its B/G ratio, as proposed by Pugh.[2] The critical B/G is 1.75: generally, a material with a higher B/G (> 1.75) is ductile, while a material with a lower B/G (< 1.75) is brittle. The Poisson’s ratio (ν) can also be used to estimate the brittle or ductile behavior of a material, as ductile materials often have larger ν (> 0.26).
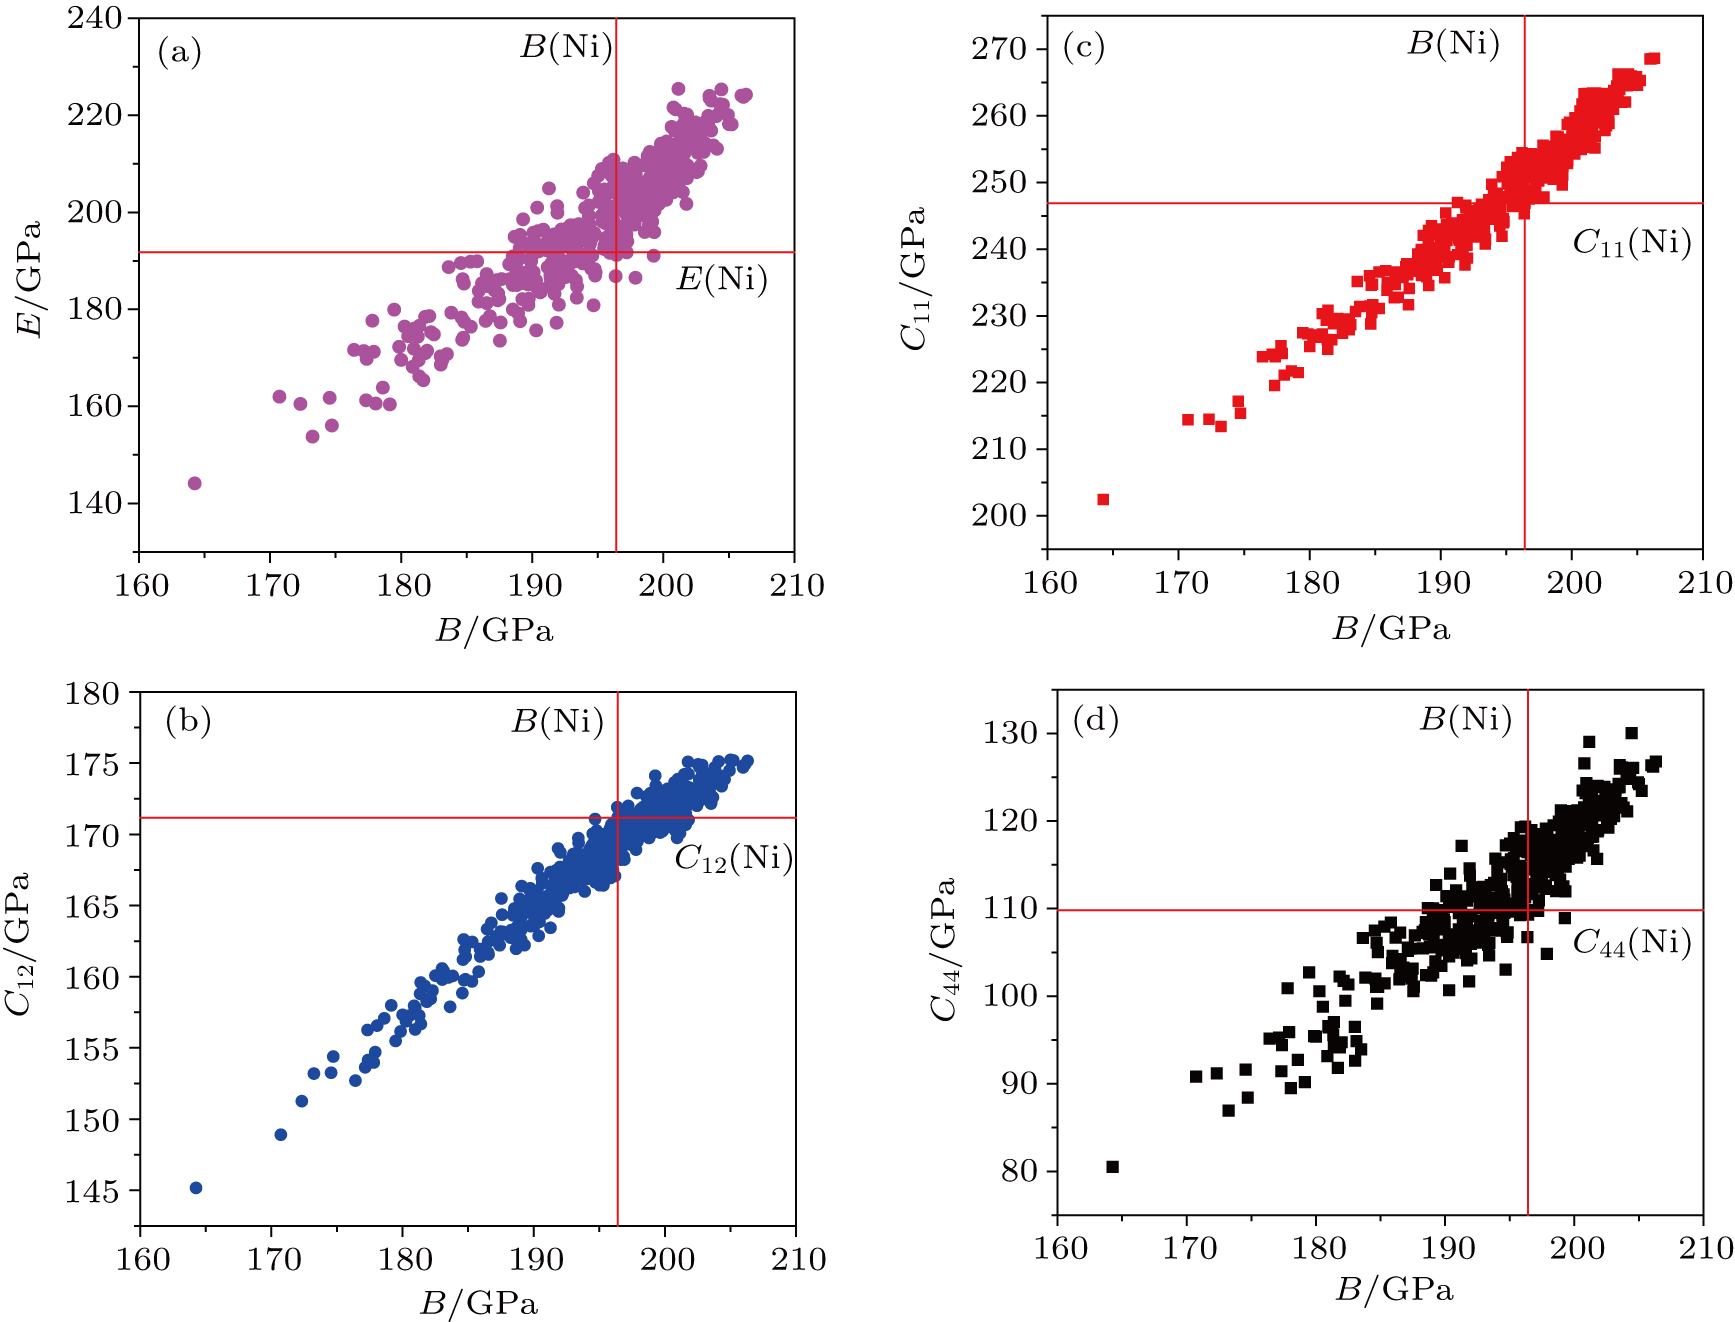
Figures
Using linear regression to fit B and G gives a linear regression coefficient of R2 = 0.8385, indicating a positive correlation, as shown in Fig.
In Fig.
As shown in Fig.
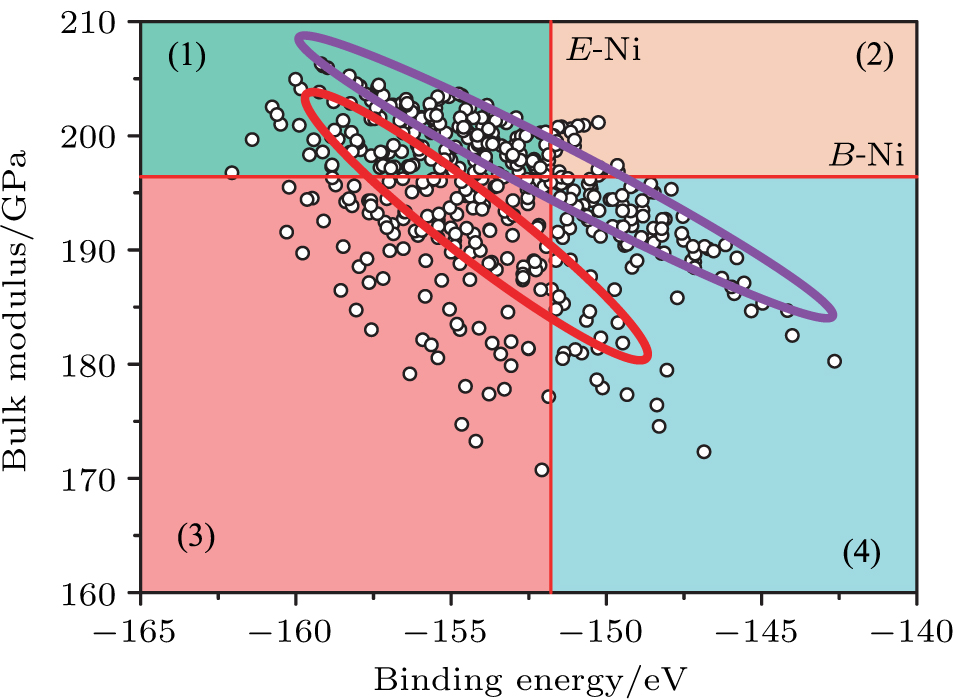
To study the relationship between binding energy and bulk modulus, we divide the compositions into four regions separated by the binding energies and bulk moduli of pure Ni.
(1) 
(2) 
(3) 
(4) 
The light green zone (1) falls within our preferred compositional space for the alloy, while the light blue zone (4) is an unfavorable constituent space. Figure
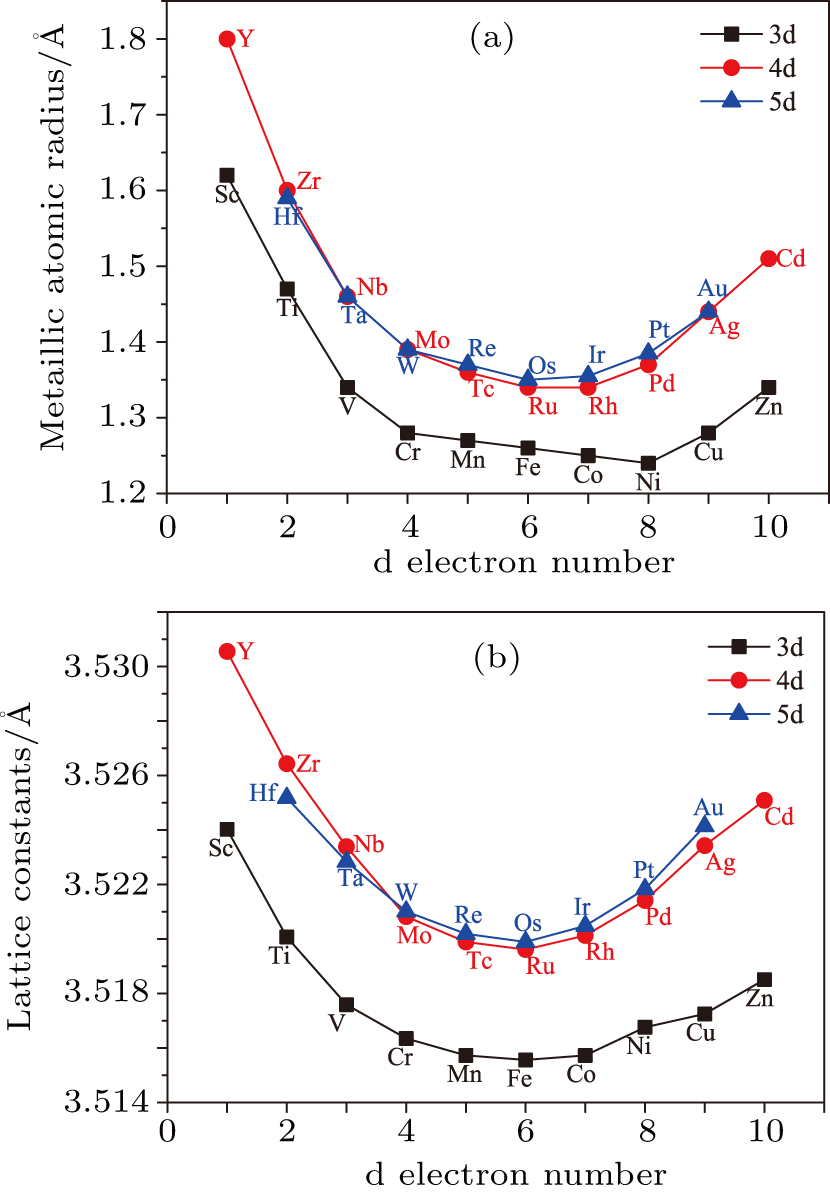
Figure
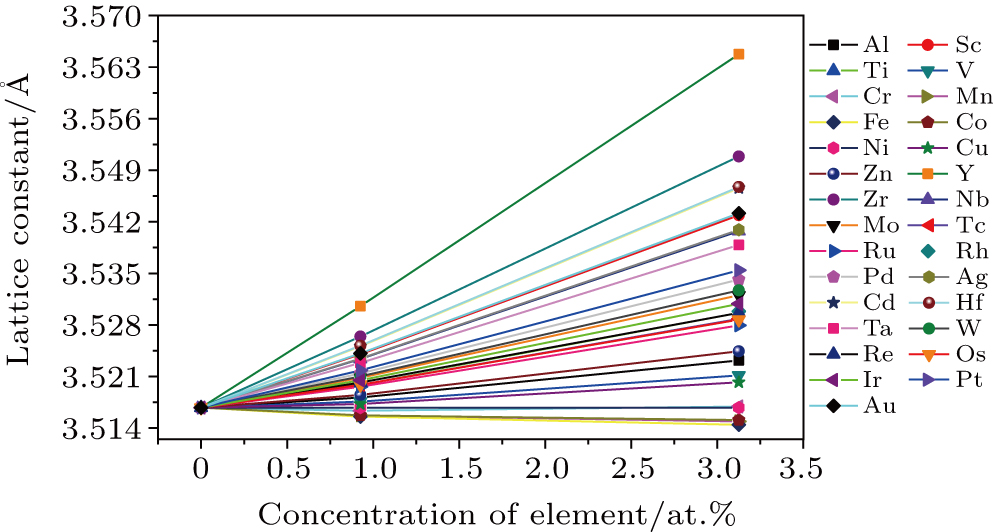 | Fig. 23. (color online) Effect of alloying concentration on the lattice parameter of various γ-Ni alloys. |
| Table 6. The metallic atomic radius of 29 elements and the lattice constant of the Ni107X and Ni31X alloys (Å). . |
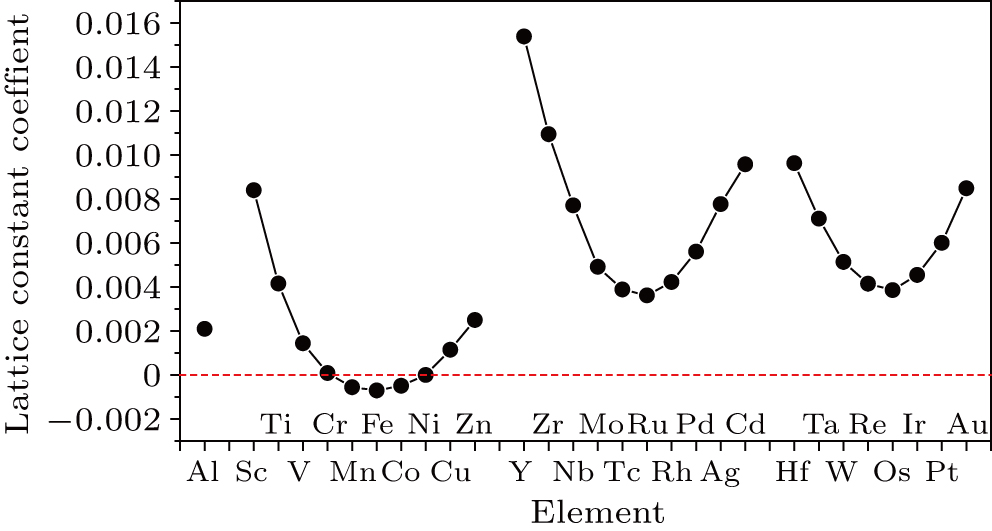
To verify whether the volume effect of the alloying element on the system in the ternary alloy system is also a linear relationship of concentration, we used a fitting method similar to that of the bulk modulus, as follows:


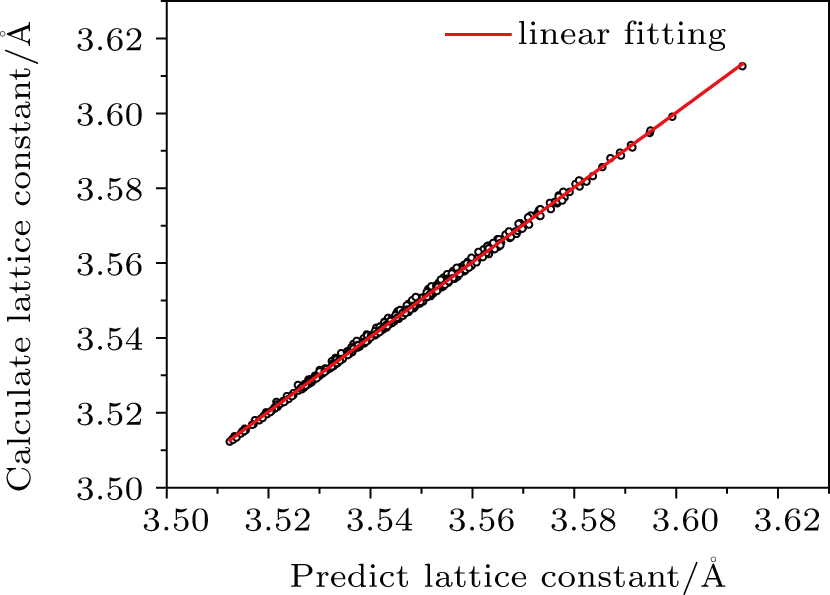
The horizontal axis in Fig.
We systematically investigated how Al and 28 transition metals affected the elastic properties of γ-Ni. The alloy strengthening was closely related to the electronic structure of the alloying elements. In the model for a single alloying elements, the bulk modulus is related to the number of electrons in the d shell of the alloying element and exhibits a “parabolic” trend over a given period, which can be perfectly fit with a quadratic function and reaches a maximum at a half-full shell of d = 5. The alloying elements strengthen γ-Ni in the following order: Os > Re > Ir > W > Tc > Ru > Mn > Cr > Mo > Fe > Pt Co > Rh > V > Ta > Ni > Nb > Pd > Ti > Cu > Al >Au Zn > Hf > Ag > Zr > Cd > Sc >Y.
Changing the size of the unit cell also changed the alloying concentration of the element. The bulk modulus had a linear relationship with the alloying concentration. Using linear regression, we fit the bulk modulus concentration coefficients of various alloys. Using a prediction formula, we successfully predicted the concentration coefficient of many test binary and ternary systems: 28 Ni30X2 systems and 435 Ni30XY systems.
Our predictions agreed well with calculated results: the linear regression showed an excellent regression parameter of R2 = 0.99431, validating the relationship between the modulus and alloying concentration. We analyzed the dependence of the bulk modulus and elastic constants (C11, C12, C44), elastic modulus (Young’s modulus, shear modulus), and Poisson’s ratio of 435 Ni30XY ternary systems, showing that adding an alloy that increases the bulk modulus B will also increase the shear modulus G, Young’s modulus E, C11, and C44 without increasing the bulk modulus B or decreasing the other parameters. C12 is special, because in a system where C12 increases, B will increase the modulus. However, B and other mechanical parameters do not have better linear consistency, indicating that the choice of alloying elements will affect more than one parameter. In addition, by calculating the total system combination, we found that all the alloying elements that increase the bulk moduli of all these systems reduced the system binding energy, indicating that the binding energy is also a good criterion for assessing the elastic properties of the alloy. Ni-based alloys showed a negative correlation between the binding energy of the alloying element in the solid solution and the elastic modulus.
We also studied how alloying affected the lattice constants of γ-Ni, revealing a linear relationship between lattice constant and alloying concentration. By using linear regression, we obtained the lattice constant concentration coefficients of various alloying elements. As before, we used the concentration coefficient to predict how adding the alloying element would affect many binary and ternary systems, and the lattice constants of 435 Ni30XY ternary systems were consistent with the calculated results. Linear regression gave an excellent regression parameter of R2 = 0.99837, validating our prediction formula. By assessing different lattice constants of the elements in the two phases, we can predict the mismatch of the alloy, which has very good applications.
| [1] | |
| [2] | |
| [3] | |
| [4] | |
| [5] | |
| [6] | |
| [7] | |
| [8] | |
| [9] | |
| [10] | |
| [11] | |
| [12] | |
| [13] | |
| [14] | |
| [15] | |
| [16] | |
| [17] | |
| [18] | |
| [19] | |
| [20] | |
| [21] | |
| [22] | |
| [23] | |
| [24] | |
| [25] |


