Active control of wall-bounded turbulence for drag reduction with piezoelectric oscillators
Bai Jian-Xia1, 2, Jiang Nan1, 3, †, Zheng Xiao-Bo1, Tang Zhan-Qi1, Wang Kang-Jun1, Cui Xiao-Tong1
Department of Mechanics, School of Mechanical Engineering, Tianjin University, Tianjin 300350, China
Deptartment of Mathematics, Tianjin University Renai College, Tianjin 301636, China
Tianjin Key Laboratory of Modern Engineering Mechanics, Tianjin 300072, China


† Corresponding author. E-mail: nanj@tju.edu.cn

Project supported by the National Natural Science Foundation of China (Grant Nos. 11332006, 11732010, 11572221, and 11502066).

Abstract

An experimental investigation was performed for active control of coherent structure bursting in the near-wall region of the turbulent boundary layer. By means of synchronous and asynchronous vibrations with double piezoelectric vibrators, the influence of periodic vibration of the double piezoelectric vibrators on the mean velocity profile, drag reduction rate, and coherent structure bursting is analyzed at Reθ = 2766. The case with 100 V/160 Hz-ASYN is superior to other conditions in the experiment and a relative drag reduction rate of 18.54% is exciting. Asynchronous vibration is more effective than synchronous vibration in drag reduction at the same voltage and frequency. In all controlled cases, coherent structures at large scales are regulated while the small-scale structures are stimulated. The fluctuating velocity increases significantly. A periodic regulating effect on the coherent structure can be seen in the ASYN control conditions at the frequency of 160 Hz.

1. Introduction

High skin friction generated by wall-bounded turbulence, due to the higher energy consumption and the resulting environmental impact compared to laminar flow, makes the drag reduction technique in turbulence a dramatic topic not only in aeronautical and aerospace engineering, but also in many other industrial applications.[13] For wall-bounded turbulence control, a thorough understanding of the underlying physical mechanism of the wall-bounded turbulence and an efficient control technique are both indispensable.[410] Active control can adapt to changes in flowing conditions and realize optimal control.[1119] Modern micro-electromechanical systems (MEMS) provide powerful tools for active control.[20,21] Among various active control schemes, wall deformation is a reliable and efficient solution. Grosjean et al.[22] tested the MEMS based pneumatic wall-deforming device, and found that the device was reliable even in transonic aircraft that experience great temperature variation. Cattafesta et al.[23] proposed the cantilever beam consisting of a piezoelectric ceramic sheet and a steel disc that were bonded together, and worked out the frequency response function of the piezoelectric vibrator by using an optimization algorithm. Segawa et al.[24] designed a set of devices that generated wall-normal vibration through an actuator array and effectively lowered the regularity of the banding structure in the near-wall region. Itoh et al.[25] used a loudspeaker to stimulate a polyethylene sheet on the wall and make it vibrate along the normal direction, thus realizing the drag reduction rate of 7.5%. Cattafesta et al.[26] made a summary of actuators used in various active control schemes, and pointed out that piezoelectric vibrators were one of the most important active control modes.

An active control scheme with double piezoelectric vibrators was employed in the present experiments. On the basis of the research with a single piezoelectric vibrator,[2729] interference and regulation of multi-scale coherent structure bursts in a turbulent boundary layer were achieved by synchronous and asynchronous vibration of double piezoelectric vibrators respectively, which were embedded on the wall along the span-wise direction, and thus the drag reduction was achieved through different amplitudes and frequencies on the piezoelectric vibrators.

2. Experiment setup

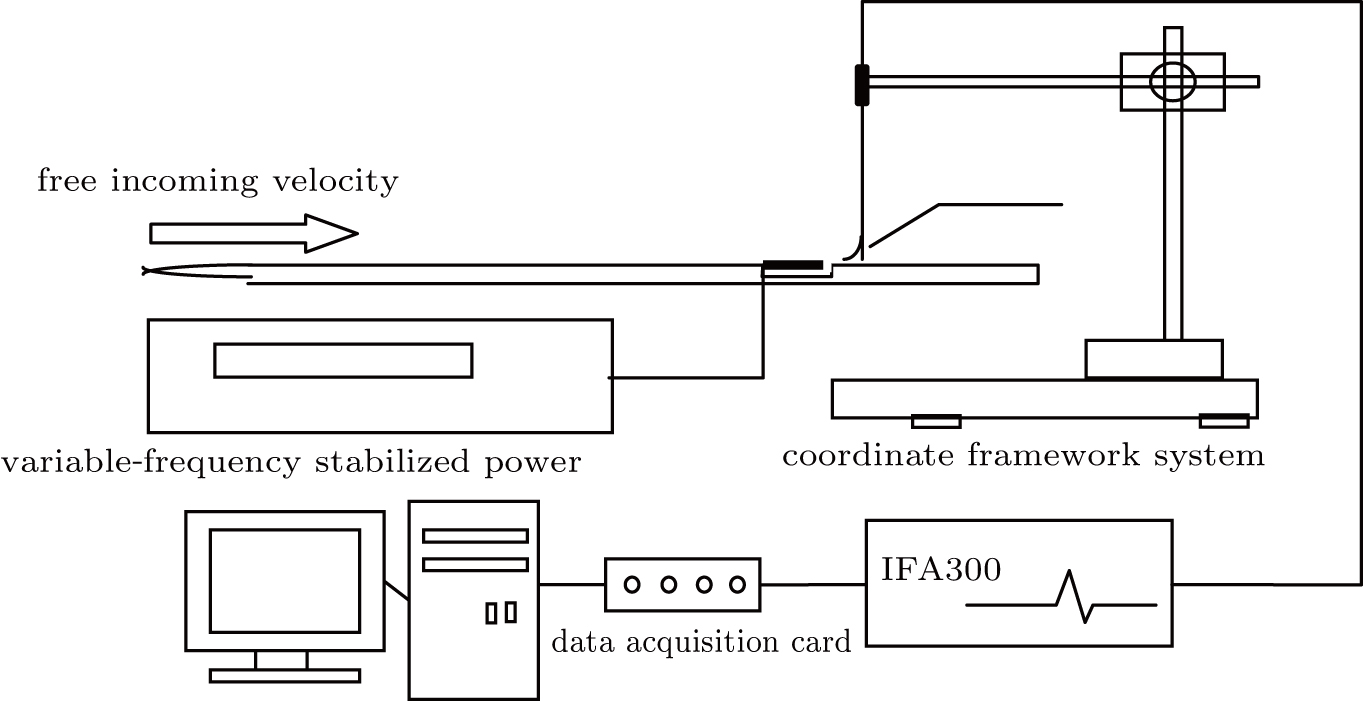
The experiment was carried out in a closed-circuit wind tunnel with a test section of 1500 mm (length) × 800 mm (width) × 600 mm (height). The zero-pressure gradient boundary layer flow was developing along a smooth flat plate of 15 mm × 600 mm × 1700 mm mounted on the center line vertically. The test plate was made of Plexiglas with a half-elliptical leading edge of a major to minor axis ratio of 16:1. A 2 mm diameter trip wire fixed downstream from the leading edge was used to develop the boundary layer on the test plate. The free-stream turbulence intensity was less than 0.2% owing to the use of porous plates, honeycombs, and mesh screens. On the center line 1090 mm away from the leading edge of the experimental plate, a 150 mm-long and 100 mm-wide cavity was made on the test plate at the location where the control actuators and measurement would be performed. Figure 1 is the schematic diagram of the experimental setup.

Fig. 1. Schematic diagram of the experimental setup.

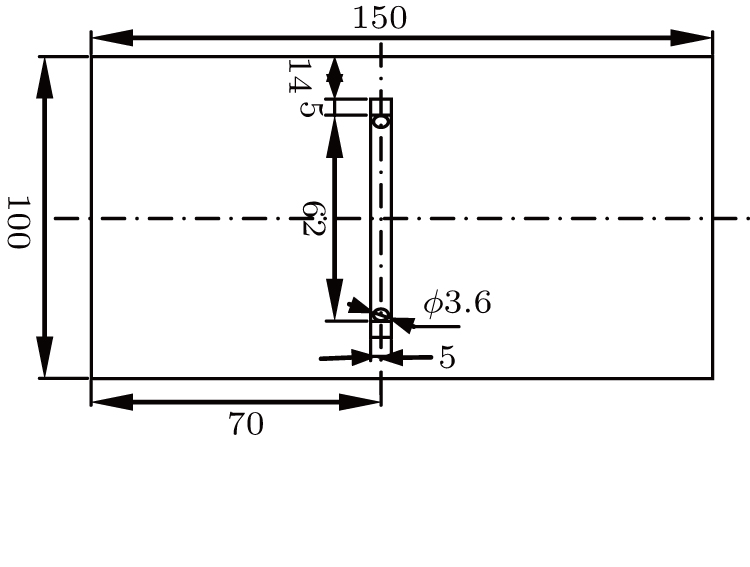
The piezoelectric vibrators used in the experiment consisted of a 3.6 mm-wide and 0.2 mm-thick copper sheet and a 3.6 mm-wide and 0.22 mm-thick piezoelectric ceramic sheet that were bonded together. The effective vibrate length, thickness, and width of the oscillators were 30 mm, 0.42 mm, and 3.62 mm, respectively. Double piezoelectric vibrating plates were embedded in the groove along the span-wise direction (see Fig. 2), and distributed symmetrically. The two sheets were aligned at one end, and the extra part of the copper sheet was fixed to the plate at the other end. Their free ends were located at their middle position. The distance between the free ends was 2 mm. The vibrators were hung in parallel above the cavity, which was 5 mm in depth in the cantilever form. To guarantee the smooth ejection of air in the cavity, 1 mm-wide clearance between the vibrators and the surrounding plate was reserved to avoid the vibrators from touching the wall during vibration.

Fig. 2. Diagram of the double piezoelectric vibrators.

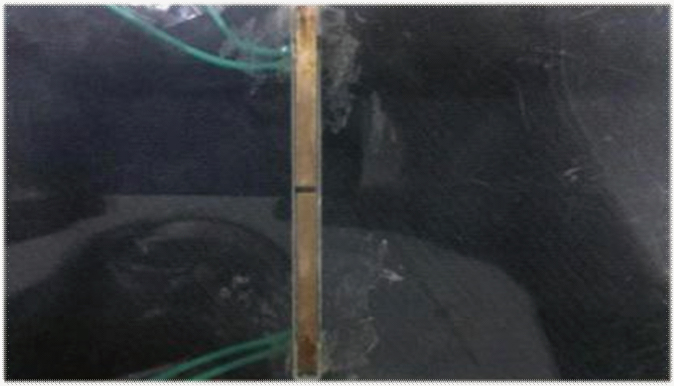
One wire was welded directly on the surface of the piezoelectric ceramic sheet and the other was welded on the copper sheet. When the two wires were connected to the AC power supply, the piezoelectric ceramic sheet would perform axial stretching vibration. The two wires were put through the small holes at the bottom of the cavity, placed at the backside of the plate, and connected to the AC power supply outside of the wind tunnel (see Figs. 2 and 3). If the copper sheets of the two piezoelectric vibrators were connected to the same electrode of the power supply and the ceramic sheets were connected to the other electrode, the piezoelectric vibrators would vibrate in the same direction, namely, the vibrators were in synchronous control conditions (SYN). Otherwise, the vibrators were in asynchronous control conditions (ASYN).

Fig. 3. (color online) Picture of the double piezoelectric vibrators.

The TSI-IFA300 hot-wire anemometer and TSI-1621 A-T1.5 hot-wire probe dedicated to measuring the boundary layer were used in the experiment. The sensitive hot-wire material was a tungsten filament 1.25 mm in length and 4 μm in diameter. The probe was calibrated using the TSI-1128 hot-wire probe calibrator. WIN-30DS4 12-bit A/D card, manufactured by the UEI company, was applied as the data acquisition card. The probe supporting rod was fixed on the CCTS-1193E 3-D automatic coordinate framework system. Table 1 shows the basic fluid field of properties of the TBL.

Table 1.

Basic fluid field of properties of the turbulent boundary layer.

.

The hot-wire probe was installed 2 mm downstream of the piezoelectric vibrators, and stream-wise velocity signals at different normal positions in the turbulent boundary layer were obtained. Different voltage amplitudes and vibrating frequencies of the piezoelectric vibrators were provided by the EVERFINE GK10005 AC variable-frequency stabilized power. Two voltage amplitudes (80 V and 100 V) and three vibrating frequencies (80 Hz, 160 Hz, and 240 Hz) were employed in this experiment. The electric power consumption was less than 0.1 W. Comparing the input power consumption to the drag reduction, the energy efficiency ratio (EER) was exciting.

3. Experimental results

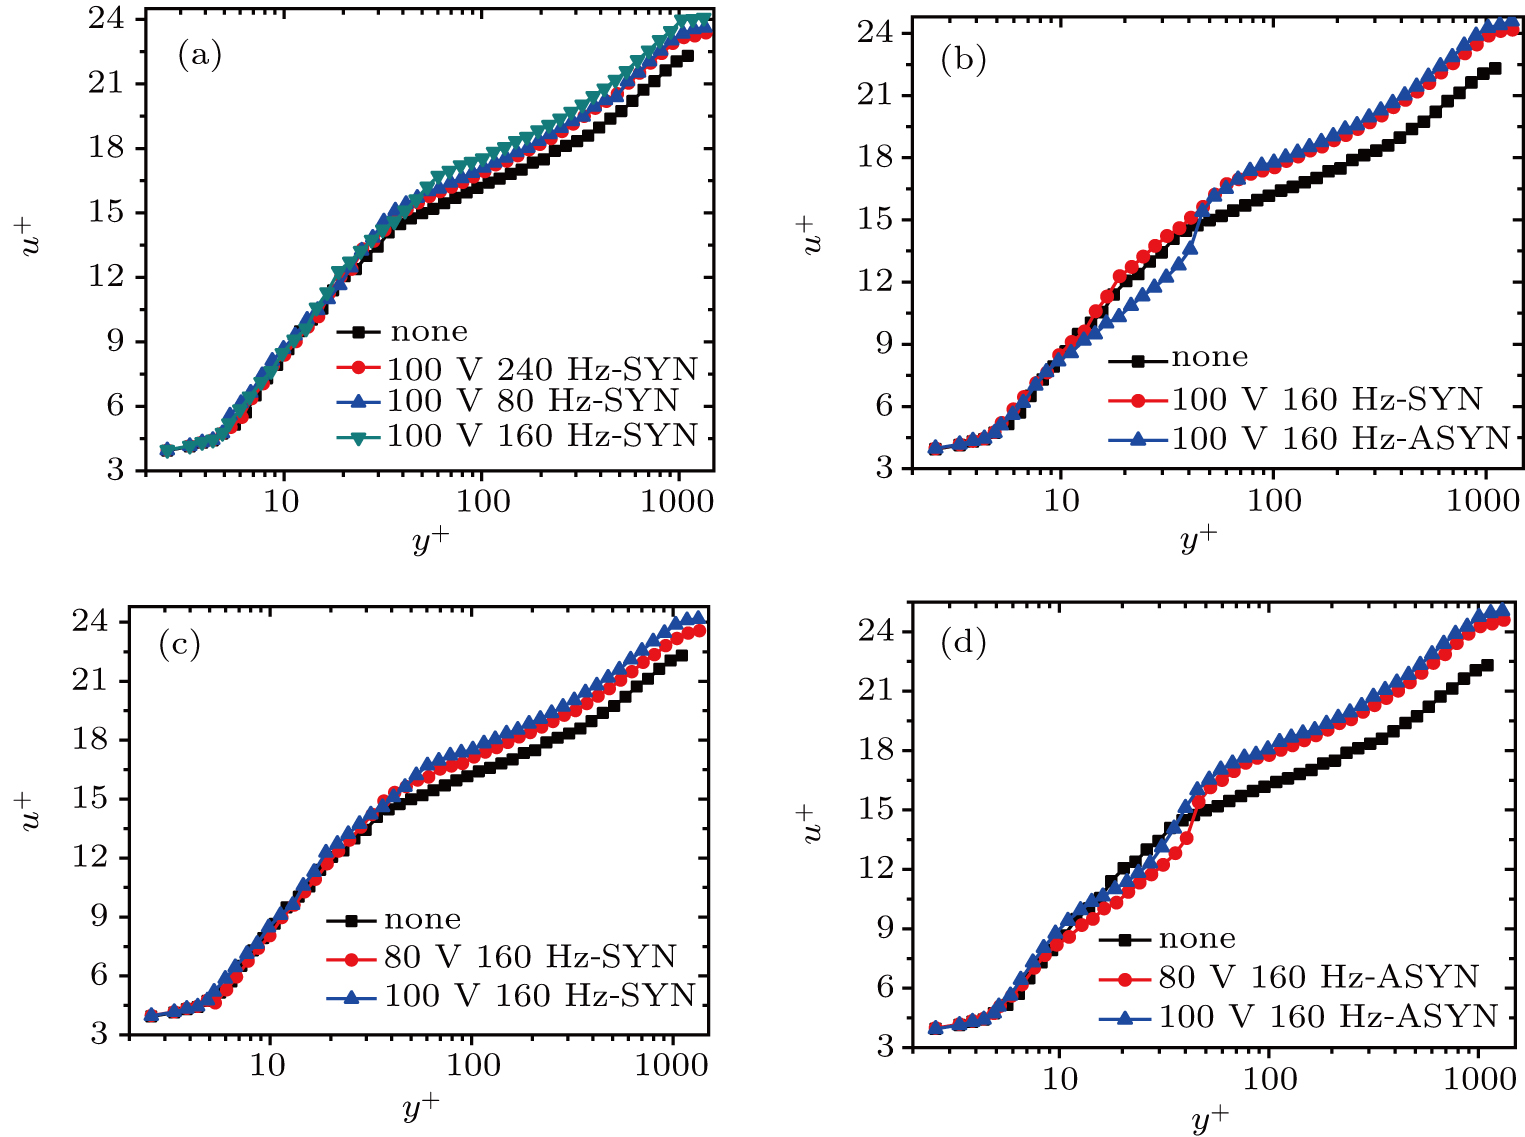
Figure 3 shows the mean velocity profiles of the turbulent boundary layer under several different conditions. The velocity has been nondimensionalized by inner-scale units u+ = u/uτ, y+ = yuτ/ν.

Figure 4(a) shows the mean velocity profiles of synchronous vibration at 100 V and three vibrating frequencies. Compared to the uncontrolled condition, there are significant up-shifts in the logarithmic region. It indicates that the 100 V/160 Hz condition has the most friction reduction effect. Figure 4(b) compares the synchronous and asynchronous control results both at 100 V/160 Hz. It shows that the asynchronous control has more of a reduction effect than the synchronous control. Figures 4(c) and 4(d) show the mean velocity profiles of synchronous and asynchronous vibrations at 160 Hz and different voltages. It can be seen that 100 V leads to more of a reduction effect than 80 V for both synchronous and asynchronous control conditions.

Fig. 4. (color online) Average velocity profiles of the turbulent boundary layer on the plate: (a) SYN vibration at different frequencies, (b) SYN/ASYN vibration at 100 V/160 Hz, (c) SYN vibration at 160 Hz, (d) ASYN vibration at 160 Hz.

By using the wall friction velocity uτ, the wall shear stress can be obtained as where ρ is the air density. The frictional factor is So, the drag reduction ratio can be written as where Cfm is the frictional factor in different conditions, and Cfu is the frictional factor in the uncontrolled condition.

Table 2 presents the drag reduction rate in various conditions. As can be seen from Table 2, the drag reduction rate is not only related to the voltage, but also to the vibrating frequency. Higher voltage results in larger amplitude of the vibrator as well as better drag reduction effect at the same vibrating frequency. At the same voltage, the vibrating frequency of 160 Hz generates the best drag reduction. When both the voltage and vibrating frequency are the same, the ASYN case has better drag reduction than the SYN case. The drag reduction rate reached 18.54% in the ASYN case at 100 V/160 Hz.

Table 2.

Wall friction velocity and drag reduction rate in various conditions.

.

Wavelet analysis is a mathematical method. It can be used to decompose a signal in both the time and frequency domains simultaneously by performing convolution on the signal and an analytic function called wavelet.[3035] The wavelet coefficient Wu(a,b) of the one-dimensional velocity signal u(t) under the wavelet function Wab(t) is defined as where the family of wavelet functions, Wab(t), is obtained by translating and stretching the wavelet generating function W(t), respectively for b and a By using the wavelet coefficient Wu(a,b), the energy of the velocity signal u(t) can be decomposed as where here W(ω) is the Fourier transform of the wavelet generating function W(t). The sum of the energy occupied by the signal at different scales is equal to the total energy of the signal.

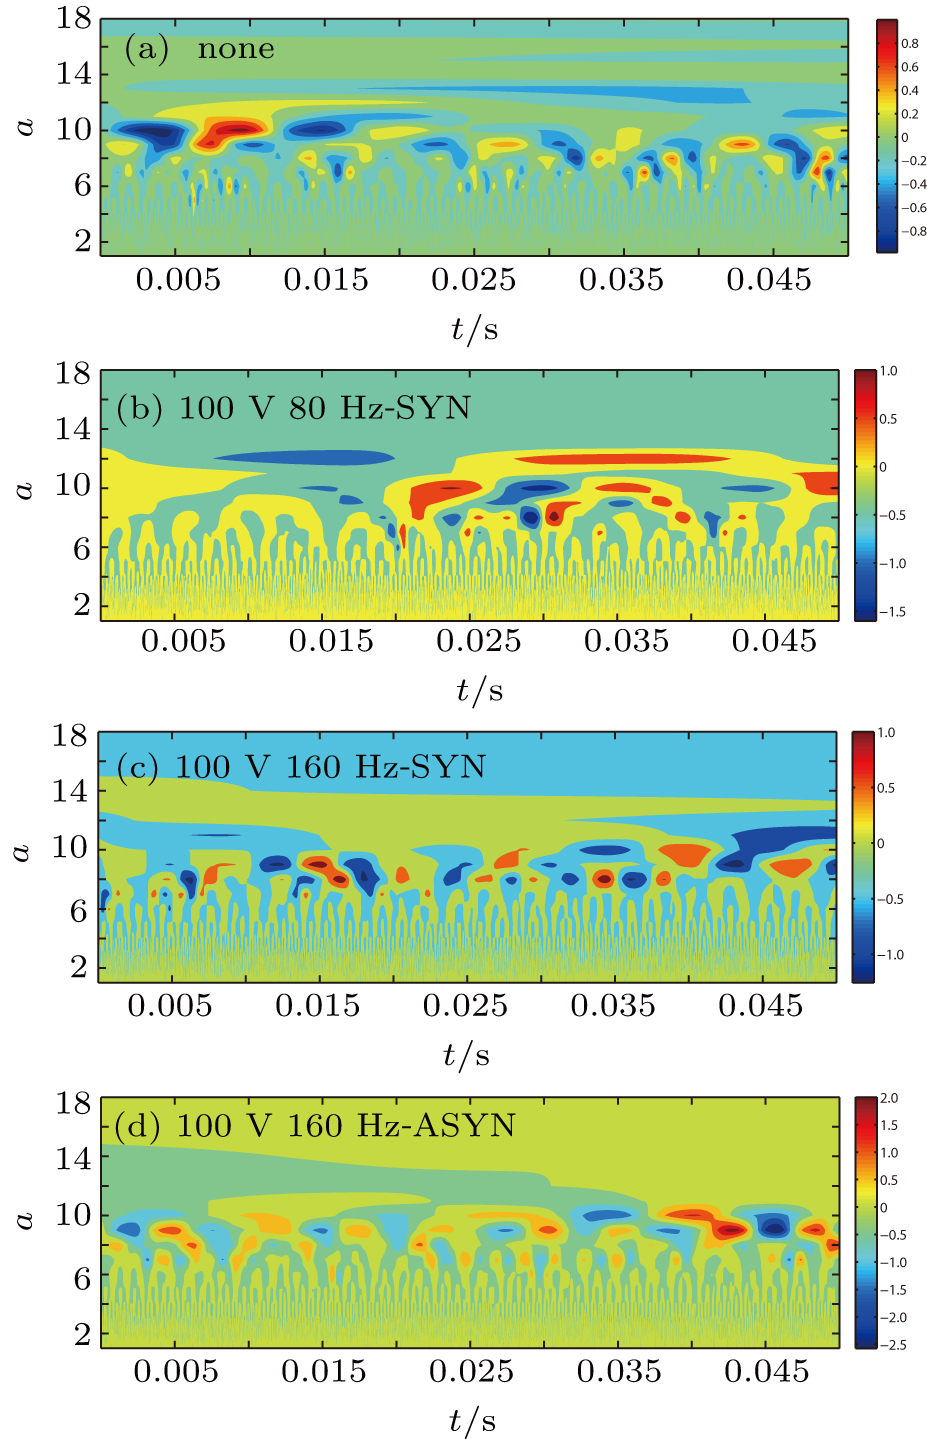
Figure 5 presents the wavelet coefficients cloud maps of time series of velocity signals for four cases: (a) the uncontrolled case, (b) the SYN vibration at 100 V/80 Hz, (c) the SYN vibration at 100 V/160 Hz, and (d) the ASYN vibration at 100 V/160 Hz. The horizontal axis represents the time t and the vertical axis is the scale parameter a. Compared to the uncontrolled case, the wavelet coefficients cloud maps change a lot in ASYN and SYN vibration cases. The burst interval becomes regular in the controlled case of 160 Hz. The absolute values of the wavelet coefficients are greater than those of the uncontrolled case. The ASYN vibration and SYN vibration cases depress the large-scale structure and stimulate more small-scale structures. The ASYN vibration is more effective than the SYN vibration.

Fig. 5. (color online) Energy cloud distribution of the multi-scale flow structures: (a) none, (b) 100 V/160 Hz SYN, (c) 100 V/160 Hz SYN, (d) 100 V/160 Hz ASYN.

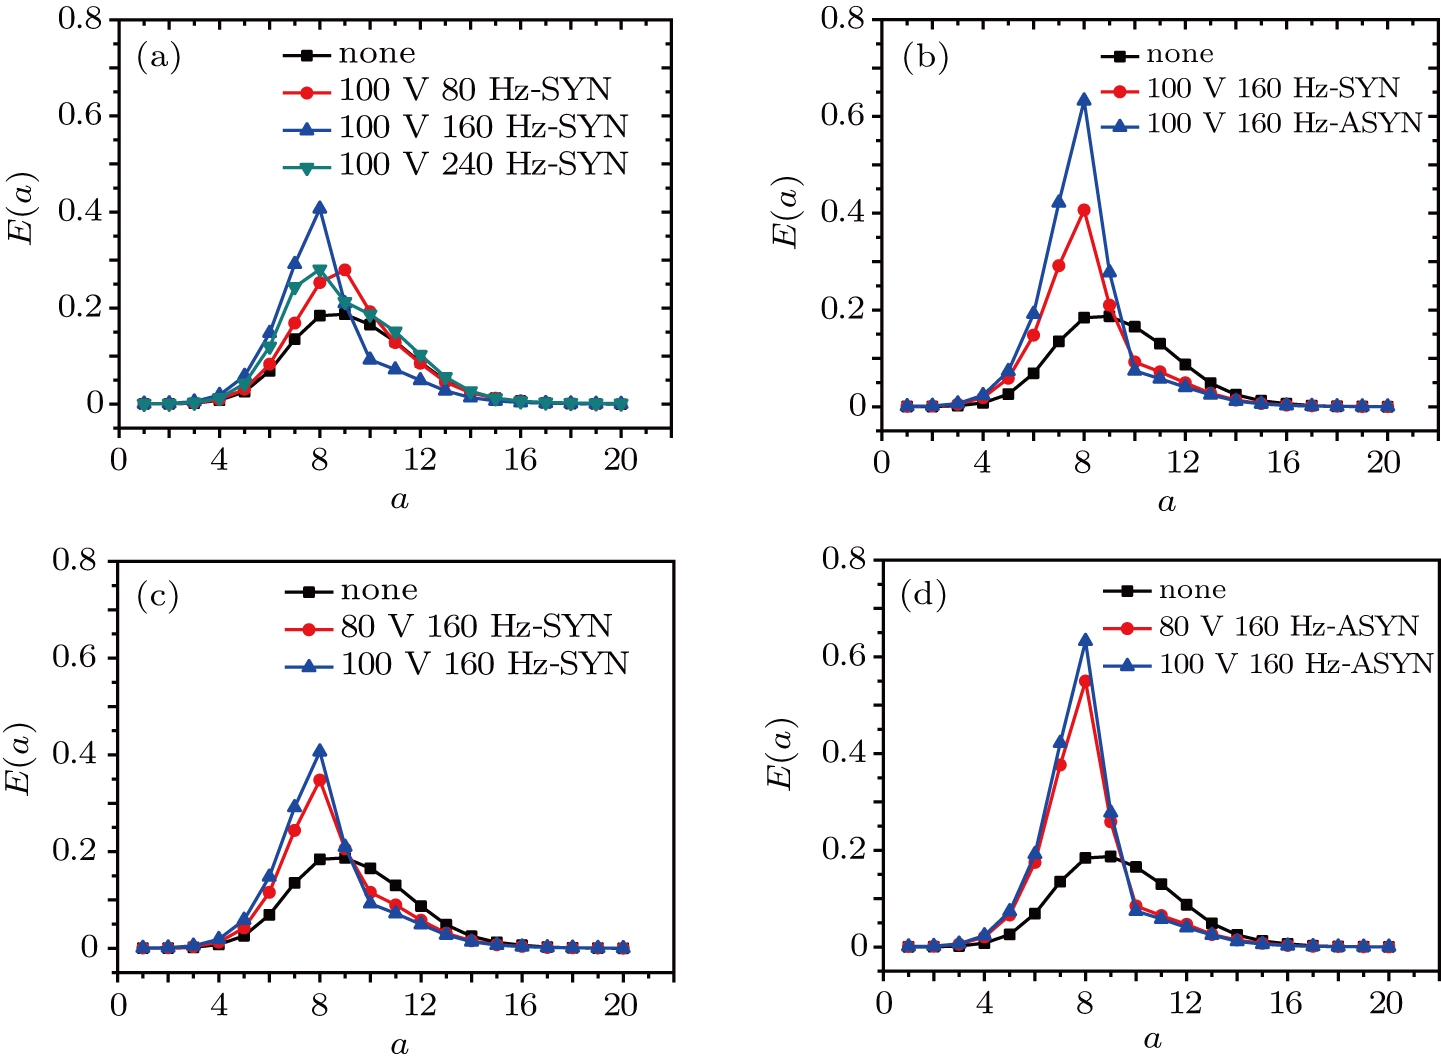
Figure 6 presents the energy distribution of the multi-scale flow structures across the scale parameter at y+ = 15. Figure 6(a) compares the energy distributions in the uncontrolled condition and three SYN control conditions at the same voltage but different frequencies. Figure 6(b) compares the energy distributions of the SYN and ASYN control conditions at the same voltage and frequency. Figure 6(c) compares the energy distributions in the SYN control conditions at the same frequency but different voltages. Figure 6(d) compares the energy distributions in the ASYN control conditions at the same frequency but different voltages. It can be seen from Fig. 6 that the vibration of the piezoelectric vibrators leads to a higher concentration of turbulent fluctuating kinetic energy around the energy-maximization scale as well as a high peak of energy. The effect of ASYN vibration is more obvious than that of SYN vibration.

Fig. 6. (color online) Scale-dependent energy distribution: (a) SYN vibration at different frequencies, (b) SYN/ASYN vibration at the same voltage, (c) SYN vibration at different voltages, (d) ASYN vibration at different voltages.

Periodic disturbances have a regulating effect on coherent structure bursting, resulting in the increase of energy at small scales and the decrease of energy at large scales. Namely, in the controlled conditions, turbulent dissipation increases, and less energy is generated.

Figure 7 shows the energy contour across the scale parameter and the wall-normal locations. It can be seen from Fig. 7(a) that the energy-maximization scale in the buffer layer (5 < y+ < 20) is the 9th scale in the uncontrolled case. In Figs. 7(c) (100 V/160 Hz SYN) and 7(d) (100 V/160 Hz ASYN), the turbulent kinetic energy concentrates around the 8th scale, the large-scale range is reduced obviously while the small-scale decreases, and well above Fig. 7(b).
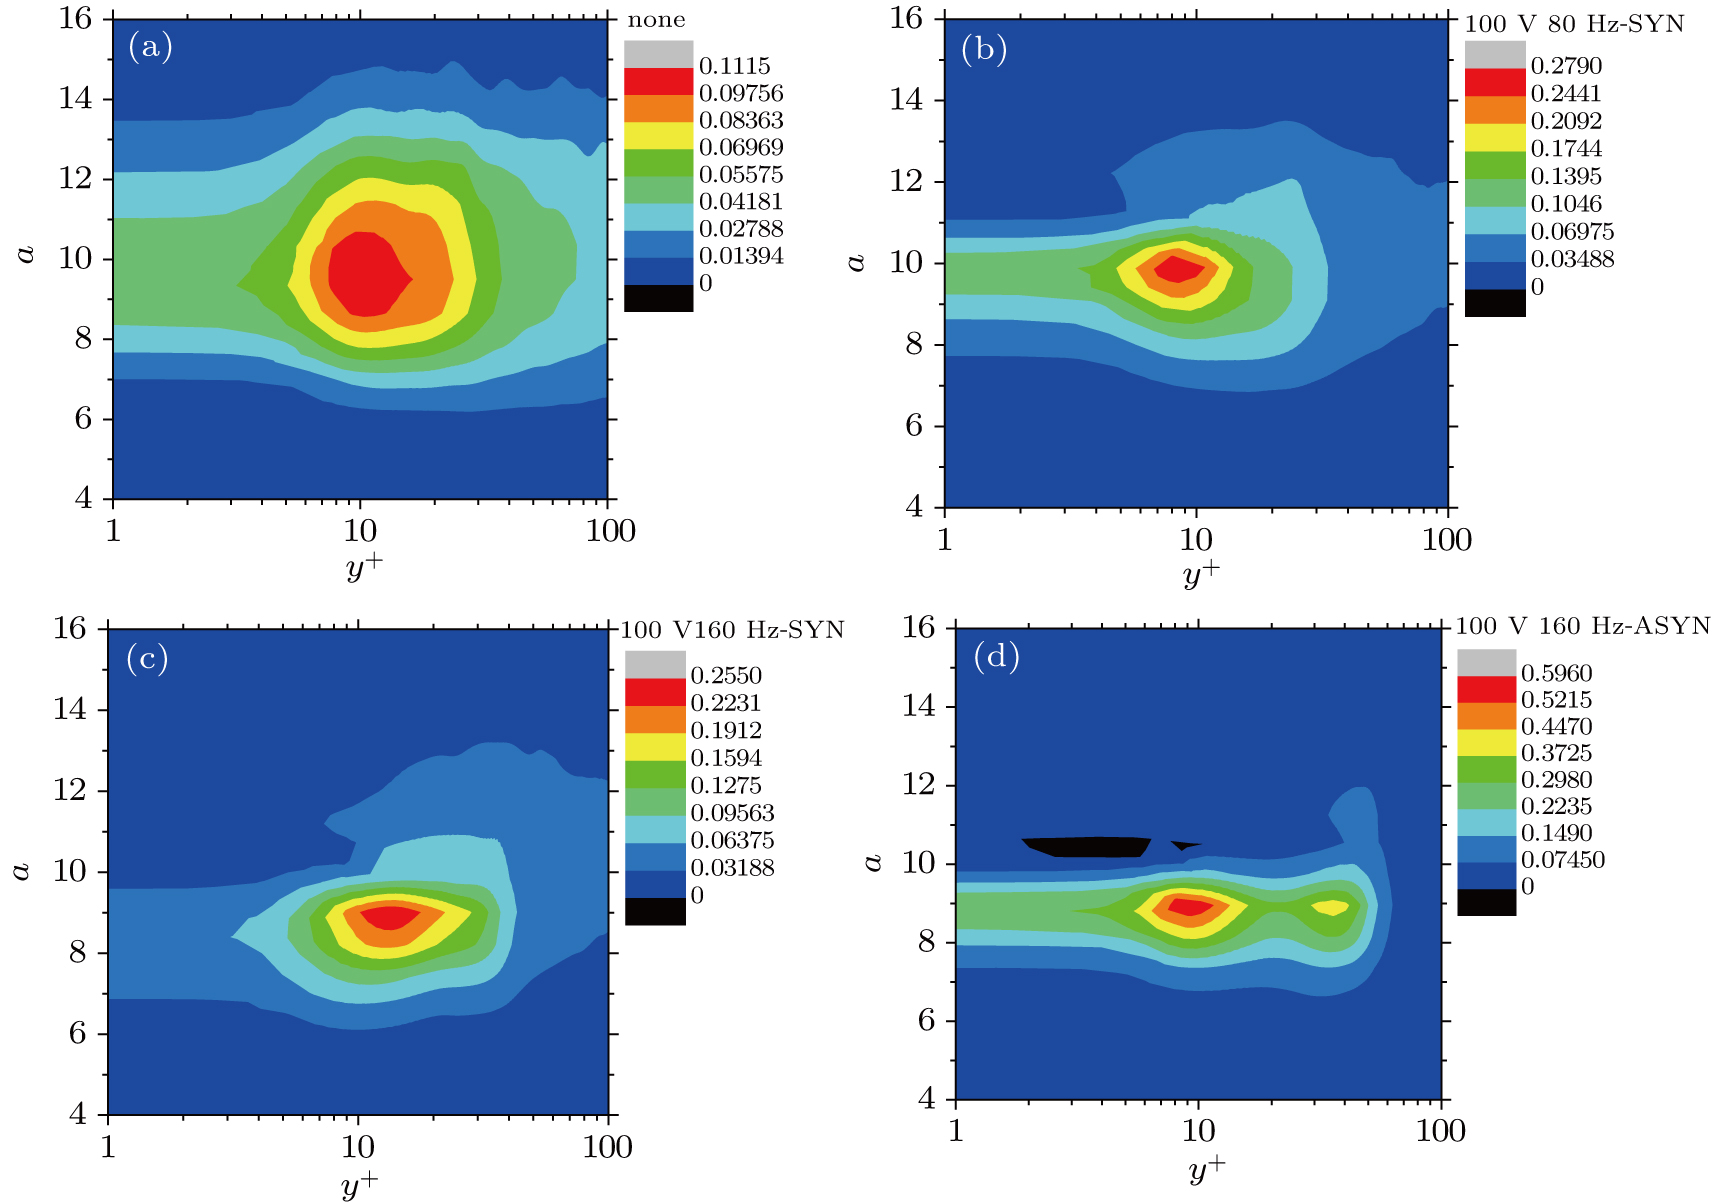
Fig. 7. (color online) Energy cloud distribution of the multi-scale flow structures: (a) none, (b)100 V/80 Hz SYN, (c) 100 V/160 Hz SYN, (d) 100 V/160 Hz ASYN.

In Fig. 7(c) (100 V/160 Hz SYN), the maximal energy reaches more than 2 times of that of the uncontrolled condition, and well above that in Fig. 7(b) (100 V/80 Hz SYN). In Fig. 7(d) (100 V/160 Hz ASYN), the large scale range with higher energy is reduced obviously and the maximal energy reaches more than 5 times of that of the uncontrolled condition. It indicates that the periodic regulating SYN and ASYN effect on the coherent structure by double piezoelectric vibrators can disturb and modulate the motions of the large scale coherent structure and lead to a higher concentration of turbulent fluctuating kinetic energy. The ASYN vibration case has a better effect in focusing energy than in the SYN cases.

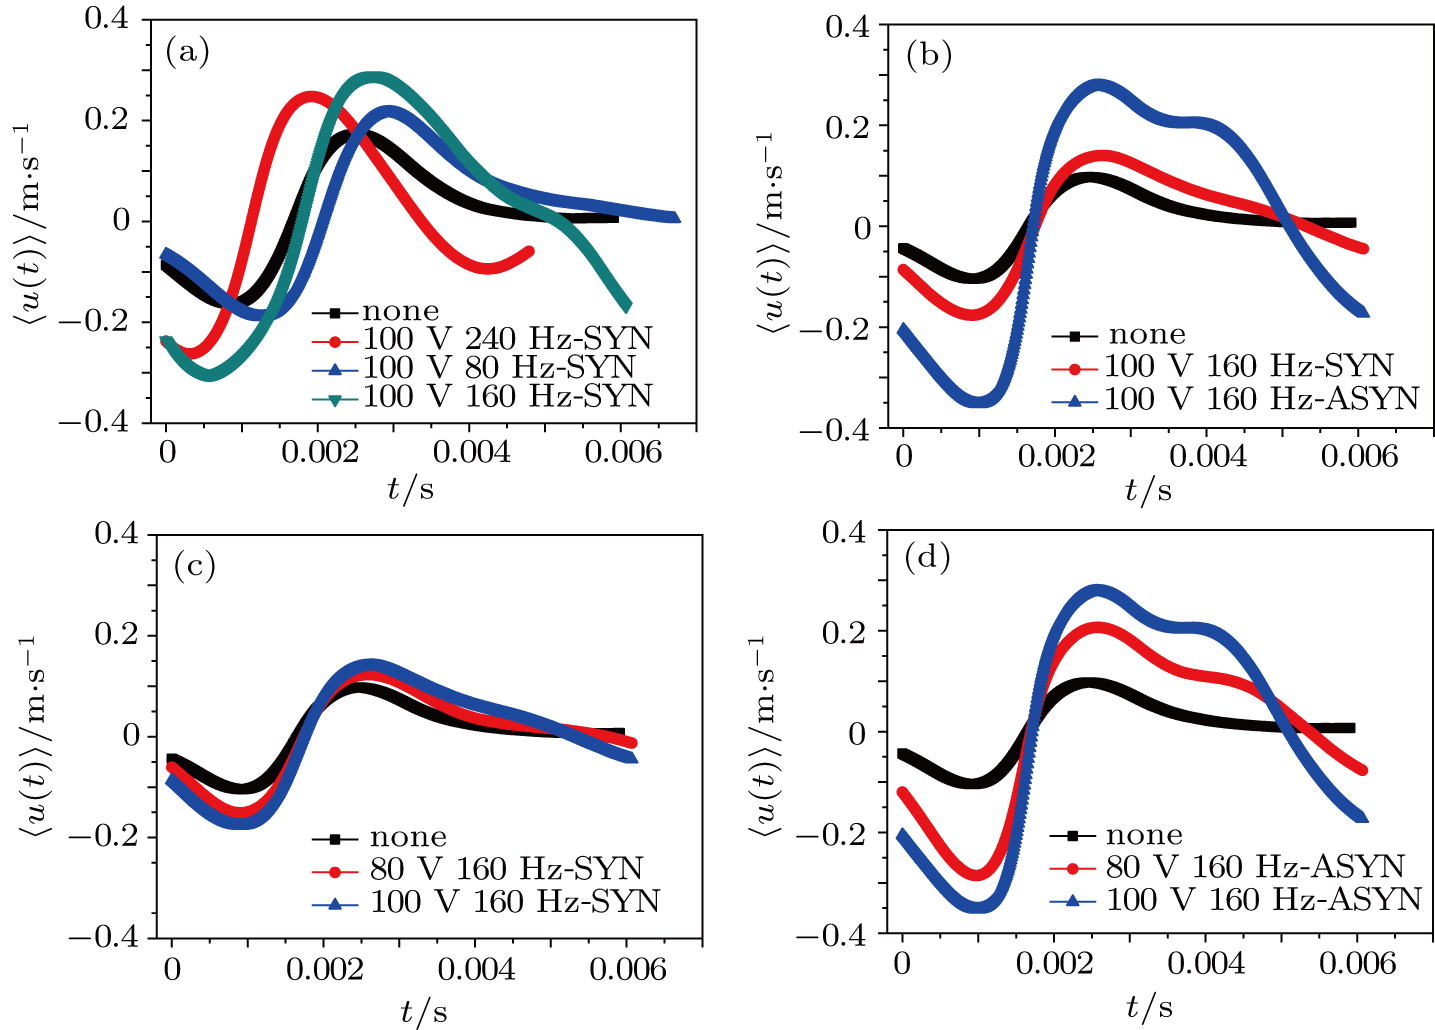
As can be seen from Fig. 8(a), the amplitudes of the fluctuating velocity increase significantly in the SYN cases at three different frequencies. Periodic modulation on the coherent structure is obvious and the sweep event of high-speed fluid inrush has a shorter duration. This indicates that the shear and skin friction between the high-speed fluid and the wall are weakened, and thus the optimized drag reduction is achieved at 100 V/160 Hz. As shown in Fig. 8(b), the maximum amplitude is observed in the 100 V/160 Hz ASYN case. Periodic disturbance generated by the asynchronous vibration of the piezoelectric vibrators has an obviously stronger effect on the sweep of the coherent structure burst. The ASYN cases have a better drag reduction effect than the SYN cases. As shown in Figs. 8(c) and 8(d), the periodic regulating effect on the coherent structure can be seen in the ASYN control conditions at the same frequency of 160 Hz. The friction drag caused by intense sweep of high-speed fluid is restrained, thus generating more of a drag reduction effect. The higher the voltage, the more the drag reduction effect will be achieved both in the SYN and ASYN control conditions.

Fig. 8. (color online) Conditional phase-averaged waveforms: (a) SYN vibration at different frequencies, (b) SYN/ASYN vibration at the same voltage and frequency, (c) SYN vibration at different voltages, (d) ASYN vibration at different voltages.
4. Conclusion

The influence of synchronous and asynchronous vibrations with the double piezoelectric vibrators on the turbulent boundary layer was analyzed from the aspects of average velocity profile, drag reduction rate, scale-dependent fluctuating energy distribution, and conditional phase-averaged waveforms of coherent structure bursting. The drag reduction rate can reach to the highest (18.54%) in the ASYN control case at 100 V/160 Hz. The effect of ASYN vibration is more obvious than that of SYN vibration. Higher voltage results in higher drag reduction rate in both SYN and ASYN conditions at the same vibrating frequency. When the vibrating frequency of the piezoelectric vibrators is close to the frequency corresponding to the energy-maximization scale of the coherent structure burst, the disturbances have the most obvious influence on the bursting and the higher drag reduction rate. Fluctuating velocity amplitude increases significantly in controlled conditions through the conditional phase-averaged waveforms. Maximum amplitude is observed in the 100 V/160 Hz-ASYN vibration condition, in which the best drag reduction effect is achieved. The periodic regulating effect on the coherent structure can be seen in the ASYN control conditions at the same frequency of 160 Hz.

Reference
[1] Kim H T Kline S J Reynolds W C 1971 J. Fluid Mech. 50 133
[2] Tang Z Q Jiang N 2011 Chin. Phys. Lett. 28 054702
[3] Bai J X Zheng X B Jiang N 2016 J. Exper. Fluid. Mech. 5 1 in Chinese
[4] Zheng X B Jiang N 2015 Acta Mech. Sin. 31 16
[5] Wang W Guan X L Jiang N 2014 Chin. Phys. 23 104703
[6] Huang W X Xu C X Cui G X 2004 Acta Mech. Sin. 36 24 in Chinese
[7] Yang G Xu C X Cui G X 2010 Acta Mech. Sin. 42 818 in Chinese
[8] Deng B Q Xu C X 2012 J. Fluid Mech. 710 234
[9] Luo S D Xu C X Cui G X 2007 Chin. J. Theor. Appl. Mech. 39 311 in Chinese
[10] Ge M W Xu C X Huang W X 2012 Chin. J. Theor. Appl. Mech. 44 653 in Chinese
[11] Gu Y Q Mou J G Dai D S Zheng S H Jiang L F Wu D H Ren Y Liu F Q 2015 Acta Phys. Sin. 64 024701 in Chinese
[12] Hu H B Du P Huang S H Wang Y 2013 Chin. Phys. 22 074703
[13] Kang S Choi H 2000 J. Fluid Mech. 12 3301
[14] Kral L D 1999 ASME Fluids Eng. Division News Letter 1
[15] Gad-El-Hak M 2000 Flow Control: Passive, Active, and Reactive Flow Management Cambridge University of Cambridge 12
[16] Kang S Choi H 2000 J. Fluid Mech. 12 3301
[17] Berger T W Kim J Lee C 2000 Phys. Fluids. 12 631
[18] Rathnasingham R 1997 System Identification and Active Control of a Turbulent Boundary Layer Ph. D. Dissertation Boston Massachusetts Institute of Technology
[19] Kim J 2003 Phys. Fluids 15 1093
[20] Karniadakis G E Choi K S 2003 Annu. Rev. Fluid Mech. 35 45
[21] Kasagi N Suzuki Y Fukagata K 2009 Annu. Rev. Fluid Mech. 41 231
[22] Grosjean C Lee G B Hong W 1998 Proceedings of the 11th MEMS Workshop 25–29 January Heidelberg, Germany 25
[23] Cattafesta L N Garg S Shukla D 2001 J. AIAA 8 1562
[24] Segawa T Kawaguchi Y Kikushima Y 2002 J. Turbulence 3 1
[25] Itoh M Tamano S Yokota K 2006 J. Turbulence 7 1
[26] Cattafesta L N Sheplak M 2011 Annu. Rev. Fluid Mech. 43 247
[27] Zhang H Zheng X B Jiang N 2016 Chin. J. Theor. Appl. Mech. 48 536 in Chinese
[28] Zheng X B Jiang N Zhang H 2015 Chin. Phys. 24 064702
[29] Zheng X B Jiang N 2016 Chin. Phys. 25 014703
[30] Farge M 1992 Ann. Rev. Fluid Mech. 24 395
[31] Camussi R Guj G 1997 J. Fluid Mech. 348 177
[32] Jiang N Zhang J 2005 Chin. Phys. Lett. 22 1968
[33] Jiang N Liu W Liu J H 2008 Sci. Chin. 51 857
[34] Liu J H Jiang N Wang Z D Shu W 2005 Appl. Math. Mech. 26 456
[35] Jiang N Wang Z D Shu W 1997 Chin. J. Theor. Appl. Mech. 29 406 in Chinese