Project supported by the National Natural Science Foundation of China (Grant Nos. 61504139 and 61275040) and the Fund from the Chinese Academy of Sciences (Grant No. Y072051002).
Project supported by the National Natural Science Foundation of China (Grant Nos. 61504139 and 61275040) and the Fund from the Chinese Academy of Sciences (Grant No. Y072051002).
† Corresponding author. E-mail:
Project supported by the National Natural Science Foundation of China (Grant Nos. 61504139 and 61275040) and the Fund from the Chinese Academy of Sciences (Grant No. Y072051002).
Finger interruptions are common problems in screen printed solar cells, resulting in poor performance in efficiency because of high effective series resistance. Electroluminescence (EL) imaging is typically used to identify interrupted fingers. In this paper, we demonstrate an alternative method based on photoluminescence (PL) imaging to identify local series resistance defects, with a particular focus on finger interruptions. Ability to detect finger interruptions by using PL imaging under current extraction is analyzed and verified. The influences of external bias control and illumination intensity on PL images are then studied in detail. Finally, in comparison with EL imaging, the using of PL imaging to identify finger interruptions possesses the prominent advantages: in PL images, regions affected by interrupted fingers show higher luminescence intensity, while regions affected by recombination defects show lower luminescence intensity. This inverse signal contrast allows PL imaging to more accurately identify the defect types.
Typical industrial screen printed silicon solar cells suffer series resistance (RS) defects. Local RS defects will result in locally increased RS[1] and change the ideal current flow path through the front metal contact,[2] resulting in a higher effective series resistance and a lower power output.[3] High-efficient solar cells are more sensitive to local defects.[4] Finger interruptions, also known as finger breaks, are typical local RS defects that can be induced during fine grid metallization, and during module interconnection and lamination.[5] Characterization of finger interruptions in solar cells is of important significance for inspecting product quality. Comparing with global current–voltage (I–V) measurements, spatially resolved imaging techniques are a valuable option to locate and to identify local RS defects. Electroluminescence (EL) is the most common imaging technique for identifying the finger interruptions within short time frames.[6] However, this technique is not suitable for distinguishing RS defects from recombination defects (low minority carrier lifetime).[7] Because both of the defects show lower luminescence intensity in the EL images. Conventional open-circuit (OC) photoluminescence (PL) cannot detect RS defects[8,9] because of no lateral current flow existing. In this paper, we demonstrate an alternative method of detecting the local RS defects based on PL imaging under current extraction, with a particular focus on detecting finger interruptions. The ability to detect the finger interruptions by using PL imaging technical under current extraction is analyzed and verified. Two crucial influence factors, i.e., external bias control and illumination intensity, are discussed in detail. Finally, the difference in finger interruption detection between the PL imaging method and the EL imaging method is discussed, and some advantages of PL-based method are emphasized.
Finger interruptions can cause locally increased RS, consequently leading to a different luminescence intensity, and the detection of interrupted fingers is based on the contrast between luminescence intensities in RS defect region and non-RS defect region. The higher the contrast, the more reliable the detection is, especially for the automatic detection technology. To quantify the influence of finger interruptions on luminescence intensity, we define a simple metric to evaluate the contrast of PL intensity (ΔPL):
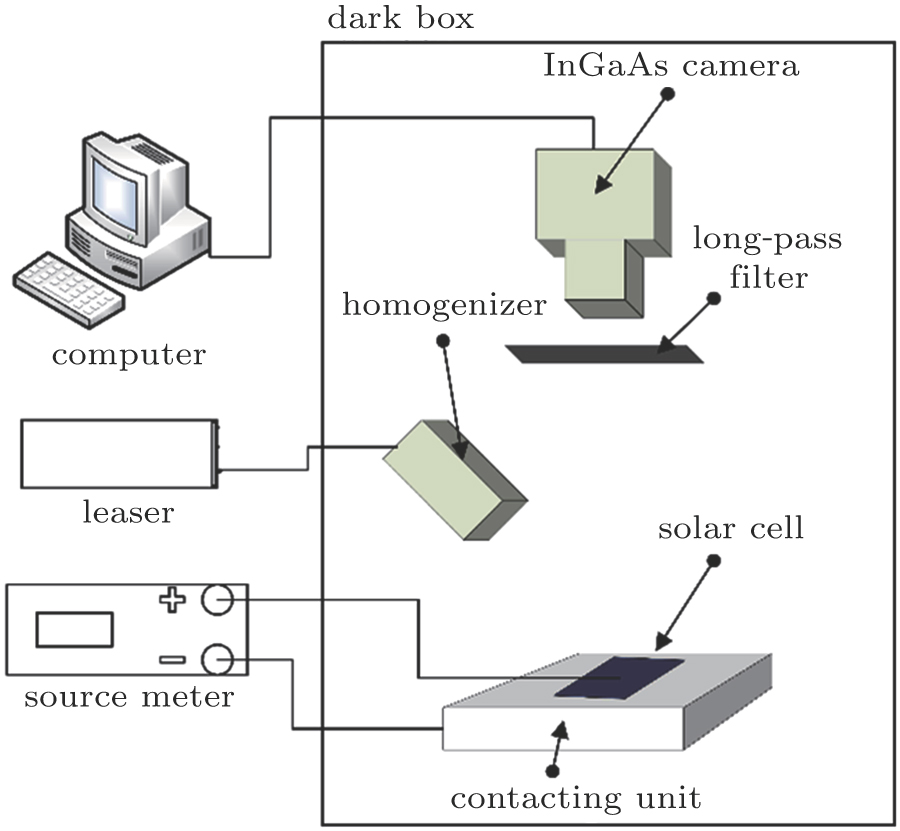
The PL and EL images were obtained using the luminescence system shown in Fig.
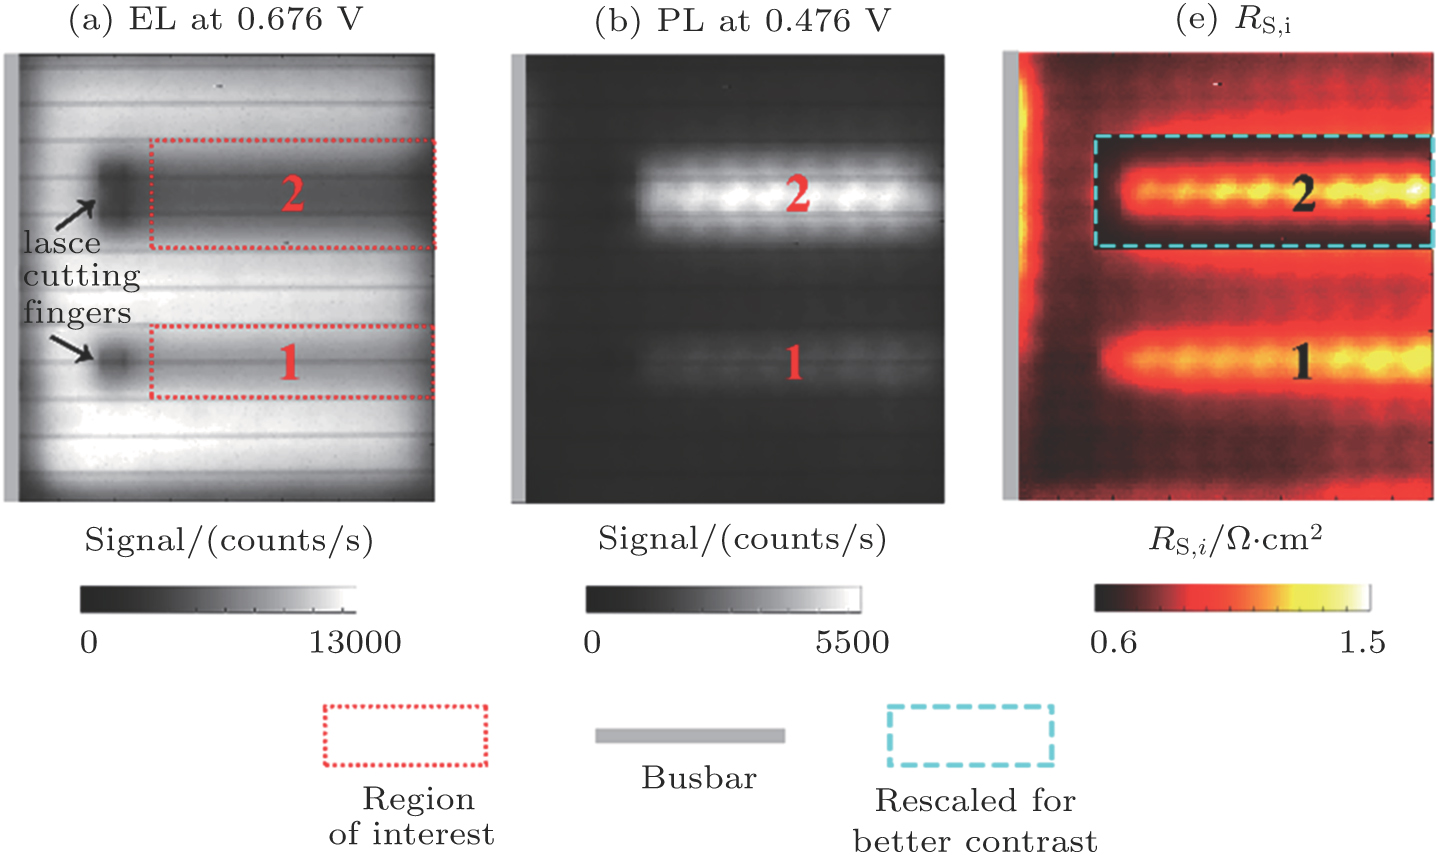
For detecting local RS defects that stem from unintended inhomogeneous processing with PL imaging, we explore the influence of well-defined RS defects on the luminescence imaging signature. Finger interruptions are introduced artificially by laser cuttings, and the interruption is created by cutting the finger twice with a gap width of 1 mm by the laser beam. Figure
The RS,i image according to Eq. (
While a solar cell absorbs the photons from the excitation light, electron-hole pairs are generated in the bulk. These excess carriers will split the quasi-Fermi levels and induce a local diode voltage. When the applied voltage of the solar cell is lower than the local diode voltage, the voltage difference provides the driving force to drive lateral current flows and to extract the excess carriers through the external contact. A finger interruption will induce a region with locally increased series resistance as discussed above, and the extraction of the excess carriers will be impeded in those regions with high RS,i. The PL signal is proportional to the product of charge carrier densities. Therefore, the regions influenced by interrupted fingers will show higher PL intensities than those in the regions without any RS defects. Figure
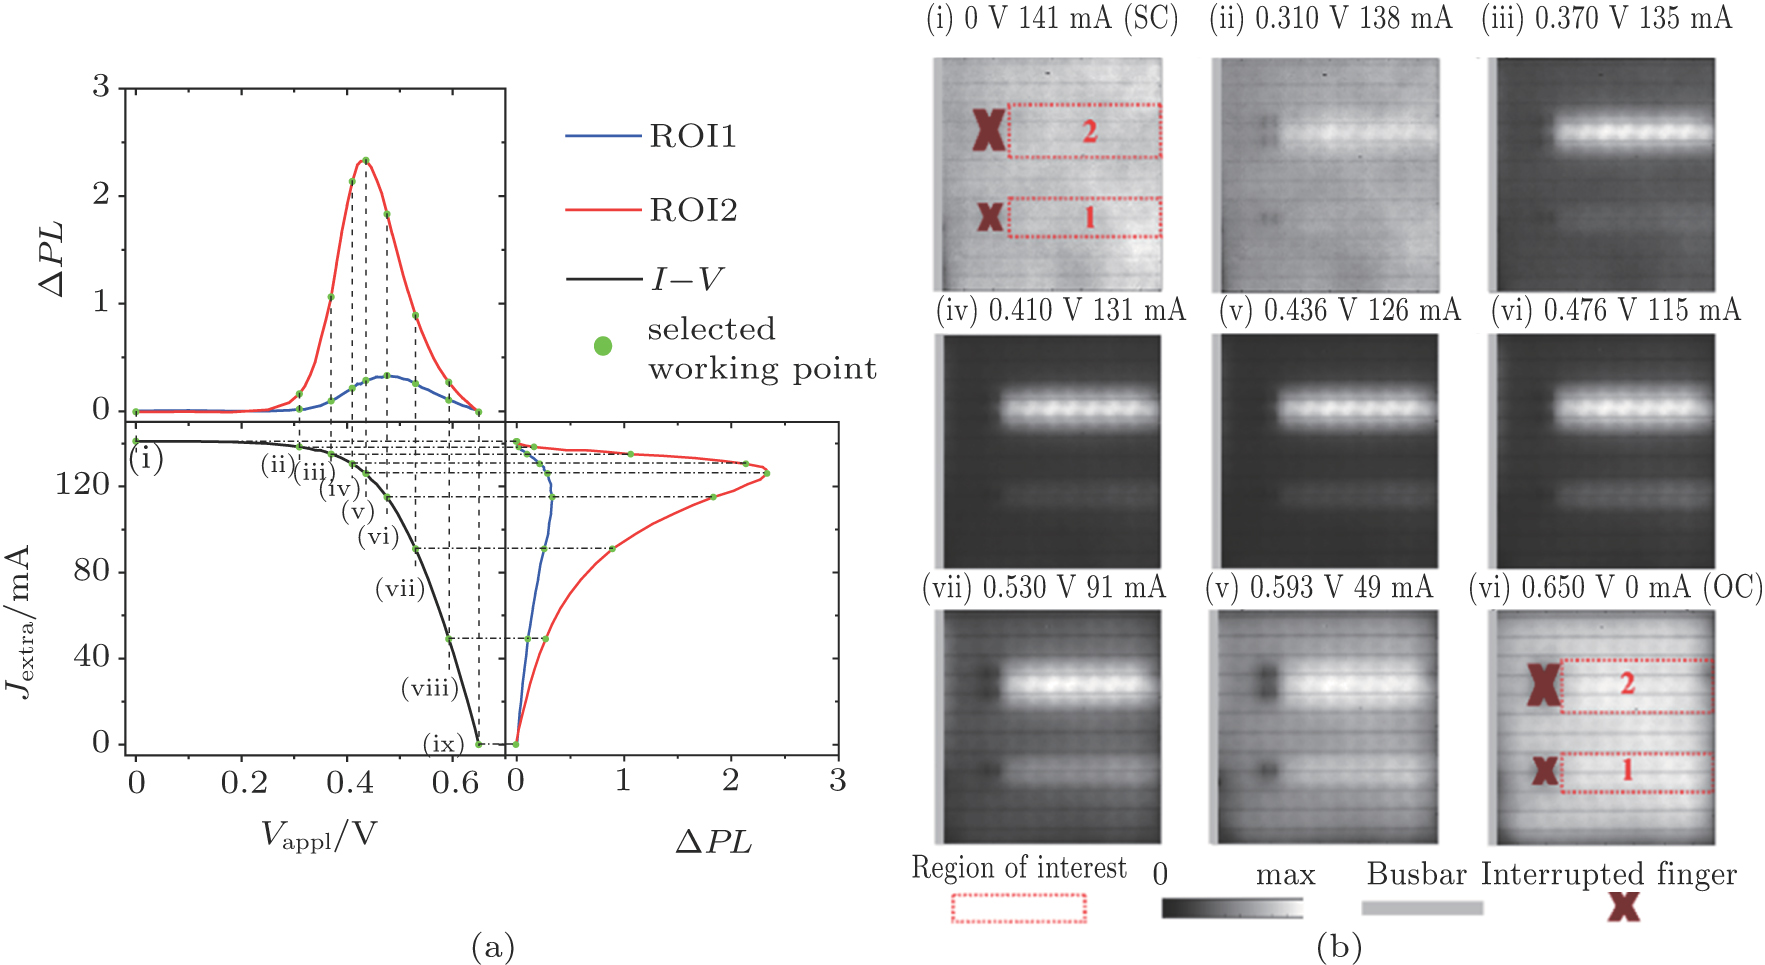
As discussed above, detection of finger interruptions using PL images is greatly dependent on excess carrier extraction. Variable forward applied voltage leads to variable driving force under a constant illumination intensity. It then induces different extraction levels of excess carriers and, therefore, different values of ΔPL. To investigate the influence of the external bias control on PL image, the applied voltage of the sample is changed to ensure that the cell works at different working points (from SC to OC). The PL images are obtained at different working points, and the values of Δ PL of ROI1 and ROI2 are calculated as well, respectively. To have a better comparison and analysis, the curve of ΔPL versus the applied voltage and the extracted current (Jextra) and the I–V curve are shown in Fig.
 | Fig. 3. (color online) (a) Influence of external bias control on ΔPL. (b) PL images of the selected working points from SC to OC. |
The finger interruption resulting in higher RS,i exhibits higher ΔPL at all current extractions, which is in agreement with the results for the case of mentioned above. It can be clearly seen that ΔPL is greatly dependent on external bias control, and can be divided into three stages according to the applied voltage. In the first stage (from 0 V to 0.30 V for ROI1), ΔPL keeps a constant value approaching to 0 with Vappl increasing. This is because the extraction of carriers from the defective region and non-defective region are saturated, which can be verified by the fact that the extracted current approximately keep a constant value of 141 mA. In this stage, the local RS defects of the interrupted fingers cannot be detected. The PL image at short circuit can only detect defects with extremely high RS,i[14] that are large enough to impede the extraction of carries and change the local short circuit current extraction, like a completely missed finger or four consecutively interrupted fingers. In the second stage, with the further increase of Vappl, ΔPL increases to a peak value (ΔPLmax) of 0.33 at an applied voltage of 0.476 V for ROI1. This can be understood as the extraction of carries from the non-defective region being still saturated or nearly saturated, whilst in the defective region it decreases rapidly. In this stage, the sensitivity of the PL imaging method to local RS defect increases to a maximum value. In the third stage, the extracted current rapidly decreases with Vappl increasing, which means that the lateral current decreases rapidly. This leads to reducing the RS effect. under the open circuit condition, ΔPL approaches to 0 as no lateral current exists. The Vappl corresponding to ΔPLmax of ROI2 has a slight decrease (about 0.04 V) with respect to ROI1. This is the result of higher RS,i in ROI2. The variation of Δ PL can be visually seen from the PL images (i)–(ix), and the finger interruptions cannot be identified by the PL images under open circuit condition or short circuit condition.
The results discussed above show that in the context of defect detection, an optimal applied voltage range exists for which ΔPL is at a maximum. However, the most suitable range of Vappl relates to various cell aspects, such as the metal finger and the emitter sheet resistance. So it is different for different type solar cells. It is also influenced by the illumination intensity and the external contact. Despite all these influence factors, we note that none of working points at a sufficient current extraction (approaching to SC) and low current extraction (approaching to OC) are suitable for interruption detection because of their low sensitivity to RS defects.
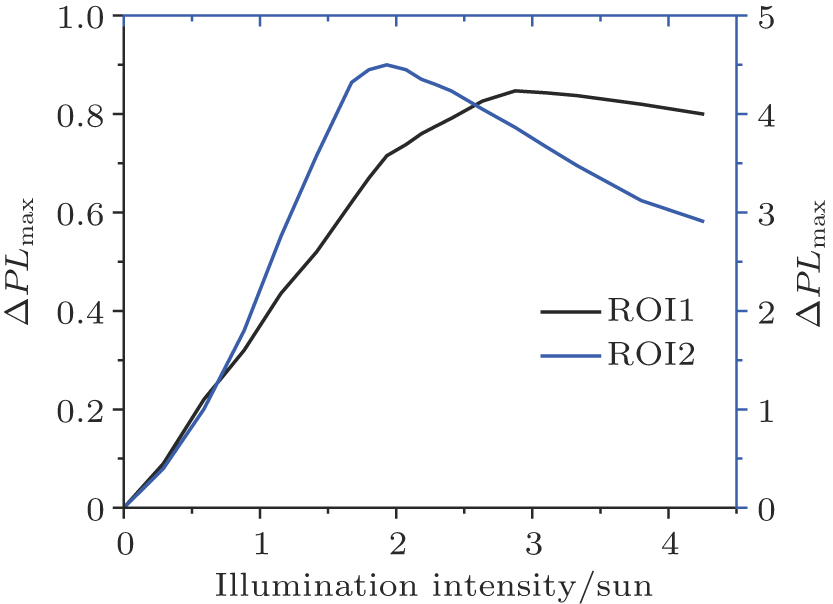
The illumination intensity is another important experimental variable that changes the working condition of solar cells. It is known that the PL signal depends strongly on the illumination intensity because of the variable carrier injection level. Therefore, we assume that the illumination intensity also has a great influence on ΔPL. To investigate the influence of illumination intensity, PL images of the sample are obtained at illumination intensities varying from 0 to 4.25 suns by changing the laser power, and then the values of ΔPLmax at different illumination intensities are acquired through the method shown in Fig.
The results and discussion above show that the detection of interrupted fingers, and any other defects with locally increased RS, are feasible in a PL image. The regions influenced by finger interruptions show that the PL signal is higher than their surrounding. Identification of finger interruptions is also available with EL images. On contrary to the increase in luminescence intensity in the PL image, interrupted fingers result in lower luminescence intensities in EL images. It is a challenge to use EL images to identify finger interruptions in solar cells with variations in bulk carrier lifetime, particularly in the case of multicrystalline cells. This is because the region with recombination defects (low carrier lifetime) and the region with RS defects both result in lower luminescence intensity.[4]
However, it is quite different in the PL imaging method that the regions affected by these two kinds of defects show inverse illumination intensities. Therefore, PL imaging seems to have greater ability to discriminate regions of low carrier lifetime and regions of high RS,i. This can be confirmed by Fig.
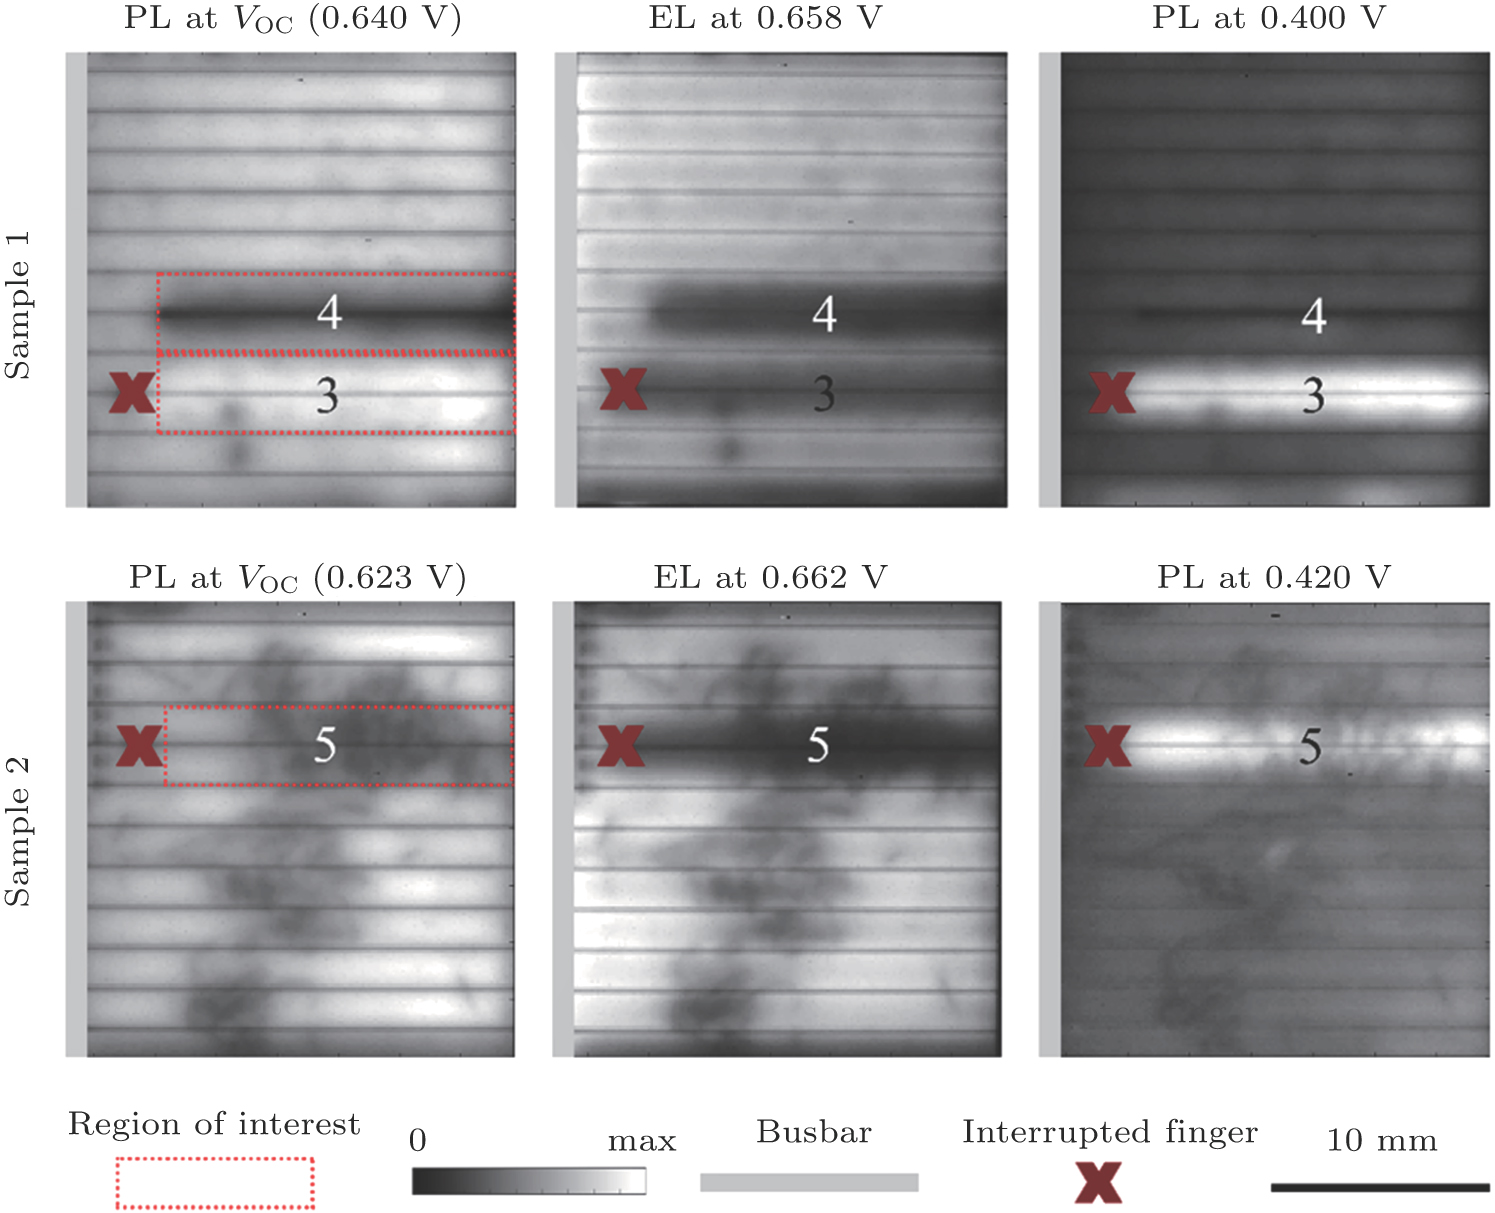 | Fig. 5. (color online) Images of PL at open circuit, EL, PL under current extraction for two samples with both finger interruption defects and recombination defects (see text for details). |
The recombination defects can be clearly seen from the PL images under open circuit condition without the disturbance of RS defects. It needs to be noted that the PL signal in ROI3 is slightly elevated because the balancing current[15] exists between ROI3 and ROI4. In sample 1, both ROI3 and ROI4 show lower luminescence intensity in the EL image. On the contrary, ROI3 shows higher luminescence intensity while ROI4 show lower luminescence intensity in the PL image under current extraction. The inversion of luminescence intensity allows the interrupted finger to be more accurately identified. In ROI5, the finger interruption and the recombination defects can also be clearly identified. It is noted that defects in ROI4 seem to have a lower influence on the PL image under current extraction than on the EL image and the PL image at open circuit. This is because the carriers near the pn junction are extracted, which will reduce the influence of surface recombination velocity on luminescence intensity.[16] In conclusion, the results accord with our previous analysis that PL imaging is more suitable than EL imaging for the identification of finger interruptions in solar cells with variational variable carrier lifetime.
In this work, we have demonstrate a PL imaging method of detecting finger interruptions or other local RS defects that result in locally increased series resistance. Firstly, samples with well-defined finger interruptions are investigated. Feasibility of detecting RS defects with PL images under current extraction are shown. We find that the sensitivity of PL imaging to finger interruptions is strongly dependent on external bias control and illumination intensity. Both low bias voltage range (approaching to SC) where the carriers are extracted sufficiently, and high bias voltage range (approaching to OC) where the lateral current is low, are found to be unsuitable for detecting interrupted fingers because of their low sensitivities. Increasing the illumination intensity appropriately is found to be a method sufficient to increase the sensitivity. Then samples with recombination defects and finger interruptions are tested with EL imaging and PL imaging. It is found that when detecting RS defects in a solar cell with significant variable minority carrier lifetime, especially in the case of multicrystalline solar cells, PL imaging shows prominent advantages over the conventional EL imaging. Regions of increased RS and regions of low carrier lifetime show inverse luminescence intensity in PL images, while both regions show lower luminescence intensity in EL images. Therefore, it allows a more unambiguous identification of finger interruptions by using PL images. We note that the solar cells studied in this work are only as large as 2 cm × 2 cm, and the conclusions remain suitable for different types of industrialsized silicon solar cells.
| [1] | |
| [2] | |
| [3] | |
| [4] | |
| [5] | |
| [6] | |
| [7] | |
| [8] | |
| [9] | |
| [10] | |
| [11] | |
| [12] | |
| [13] | |
| [14] | |
| [15] | |
| [16] |


