Transition intensity calculation of Yb:YAG*

Project supported by the National Natural Science Foundation of China (Grant Nos. 61405206, 51502292, and 51702322), the Knowledge Innovation Program of the Chinese Academy of Sciences (Grant Nos. CXJJ-16M251 and CXJJ-15M055), and the National Key Research and Development Program of China (Grant No. 2016YFB0402101)

Zhang Hong-Bo1, Zhang Qing-Li2, †, Wang Xing1, ‡, Sun Gui-Hua2, Wang Xiao-Fei2, Zhang De-Ming2, Sun Dun-Lu2
School of Aeronautics and Astronautics Engineering, Air Force Engineering University, Xi’an 710038, China
The Key Laboratory of Photonic Devices and Materials of Anhui Province, Anhui Institute of Optics and Fine Mechanics, Chinese Academy of Sciences, Hefei 230031, China


† Corresponding author. E-mail: zql@aiofm.ac.cn 1678648615@qq.com

Project supported by the National Natural Science Foundation of China (Grant Nos. 61405206, 51502292, and 51702322), the Knowledge Innovation Program of the Chinese Academy of Sciences (Grant Nos. CXJJ-16M251 and CXJJ-15M055), and the National Key Research and Development Program of China (Grant No. 2016YFB0402101)

Abstract

The Yb:YAG is an excellent high-average power and ultra-short pulse laser crystal. Transition intensity parameters and Huang–Rhys factors are fitted to its emission spectrum by the full-profile fitting method. Calculated results indicate that the emission spectrum of Yb:YAG at cryogenic temperature consists of three pure electron state transitions and two phonon-assisted transitions, one vibronic transition releases one-phonon of 3 cm−1, and the other vibronic transition absorbs one-phonon of 22 cm−1. At 300 K, the phonon assisted transition of 3 cm−1 turns into two- or more-phonon assisted transitions. The procedure absorbing phonon can reduce the thermal load of Yb:YAG and improve the laser efficiency, which may be one of the reasons why Yb:YAG has excellent performance. The emission bands of Yb:YAG are broadened thermally, and the peak values decrease by several times. The emission cross sections of Yb:YAG determined by Fuchtbauer–Ladenburg (F–L) formula are remarkably different from those calculated with , which indicates that it is necessary for a laser material to determine its transition intensity parameters in order to reasonably evaluate the laser performance.

1. Introduction

The Yb3+:YAG is an important high-power laser material used in the diode pumped solid state laser (DPSSL), which has high thermal conductivity, good mechanical property, high chemical and physical stability and excellent large crystal growth properties, and has received great attention. Rutherford et al. predicted that it can be used to obtain 100-kW edge-pumped DPSSL.[1] A continuous-wave average output power of 2.65 kW from a single composite Yb:YAG laser rod with (0.6 at.%) Yb:YAG of ϕ4 mm × 80 mm pumped with 9000 W from 940-nm InGaAs laser diodes has been reported.[2] Lucia laser in French could deliver a 100 Joules/10 ns/10 Hz pulse train from ceramic/crystal Yb:YAG,[3] and a 64-J at 10-ns output was demonstrated by diode-pumped cryogenically cooled Yb:YAG ceramic laser amplifier recently.[4] It has been also used to develop few-cycle, waveform-controlled light pulses with a repetition rate of 10 Hz and a peak power in the petawatt regime in petawatt field synthesizer in Germany.[5] A 7.07-kW Yb:YAG composite crystal zigzag slab amplifier at room temperature was developed and demonstrated with an optical-to-optical efficiency of about 29.5% and a slope efficiency of 39.5% by Li et al. in Institute of Applied Electronics, China Academy of Engineering Physics.[6]

Patel et al. reported the crystal growth, spectral, thermal and laser properties.[7] Due to the fact that ff transitions of Yb3+ are very few in number, which is usually far less than the number of the crystal field parameters and also the number of intensity transition parameters , the crystal field parameters and transition intensity parameters ae rarely reported for Yb3+, although they are important for understanding the electron structure and optical transition mechanism of Yb3+ in solid. Recently, the method to fit crystal filed parameters with numerical derivative of matrix eigenvalues,[8] and full profile fitting the emission or absorption spectrum to obtain transition intensity parameters[9,10] has been developed, and applied to Yb:Sc2O3, Yb:GdTaO4, etc. The crystal parameters of Yb:YAG have been determined in Ref. [7]. In this work, we apply the full-profile fitting method to the emission spectrum of Yb:YAG to determine its transition intensity parameters and Huang–Rhys factors, and explain why Yb3+:YAG has high laser-efficiency.

2. Experiment

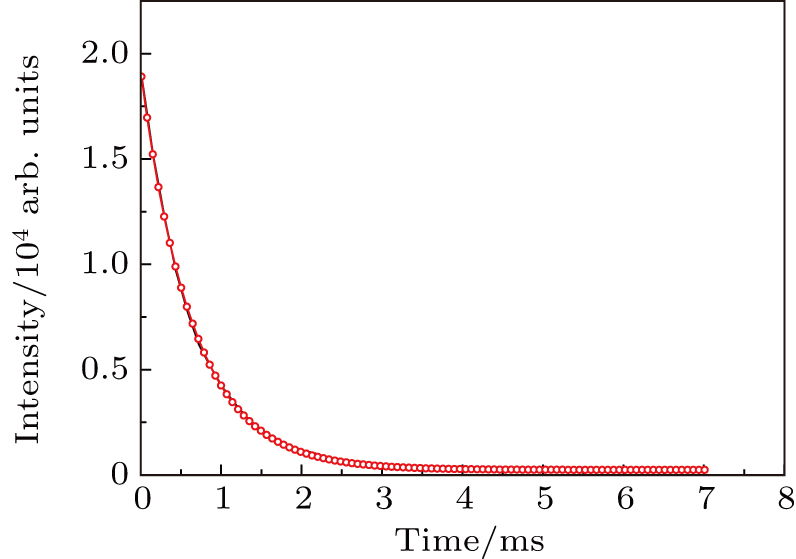
(10 at.%) Yb:YAG was grown by the Czockralski method in a furnace JGD60, made in the 26th Institute, China Electronics Technology Corporation (CETC) in China, and its photoluminescence spectra at 8 K and 300 K were measured under the light excitation of 914.8 nm with Fluorolog-3-Tau made in JOBIN YVON in France. The photoluminescence decay curve was measured at a monitor wavelength of 1028.2 nm and an excitation wavelength of 914.8 nm, which is a single exponential decay with decay constant 643 μs and shown as in Fig. 1.

Fig. 1. (color online) Time-dependent intensity of (10 at.%) Yb:YAG at 8 K (λex = 914.8 nm, λem = 1028.2 nm).
3. Transition intensity calculation and discussion
3.1. Transition intensity fitting of the emission spectrum of Yb:YAG at 8K

The Yb3+ dopants in YAG replace Y3+ ions and occupy the site symmetry D2, which results in nine non-vanished pure imaginary intensity parameters with (k, t, p) = (2,3,2), (4,3,2), (4,5,4), (6,5,4), (4,5,2), (6,5,2), (6,7,6), (6,7,4), and (6,7,2), which are independent variables to be fitted, and the estimated initial values are shown as in Table 1.

Table 1.

Initial and fitted parameters of in 10−13 m, Huang–Rhys factor s, FWHM in unit nm, and manual adjusted C in 10−18 s.

.

The crystal field energy levels of Yb3+ in YAG have been evaluated in Ref. [11], which is denoted as |J, Γi〉(r), where Γi is point group irreducible representation, r represents the multiplicity of |J, Γi〉. |J, Γi〉(r) refers to the dominant component of the corresponding wavefunctions. For convenience, the energy levels of Yb:YAG are labeled as Ei (i = 1, 2, 3, 4, 5, 6 and 7) form low to high energy, which is 0, 564, 606, 787, 10329, 10629, and 10829 in unit cm−1 (wavenumber). The calculated photoluminescence emission intensity of Yb3+, including electric and magnetic dipole transitions, can be expressed as[9]

where I represents the initial state |5/2, Γ1〉 (1) with E5, F denotes the final state |7/2, Γ6〉 (1), |7/2, Γ6〉 (2), |7/2, Γ7〉 (1), |7/2, Γ7〉 (2) with energies E1, E2, E3, and E4, and their vibronic transitions. Namely, the emission spectrum of Yb:YAG is composed of the transitions of E5E1, 2, 3, 4, E5 + phonon → E2, E5E2 + phonon. The σI is a constant relating to the measurement instrument, initial state population and Planck constant, λ is the wavelength variable, AIF is the transition probability of IF, λIF, and νIF are the transition center wavelength and frequency of IF, ϕIF is the profile function with full width at half maximum (FWHM) wIF.

In order to eliminate the arbitrariness resulting from measurement, the transition intensity and energy life time of |5/2, Γ1〉 (1) with E1 are fitted at the same time to the following equation:[9]

where I(λ)obs is the observed spectral intensity, is the observed fluorescence decay time, which is 643 μs or 950 μs here, , λIF, wIF, σI are variable parameters to be fitted. On the other hand, Huang–Rhys factors s are also to be fitted for vibronic transitions. In order to obtain good convergence for the different spectral intensities, σI is expressed as the product of tow parameters[9]
where C is an adjustable parameter manually, usually on the order of 10−19 s ∼10−14 s, and is a fitted parameter by computational routine.

Three pure electron state transitions, which correspond to the emission peaks at 1023.5 nm, 1028 nm, and 1046.1 nm, and three vibronic coupling transitions peaking at 1021.4 nm and 1028.28 nm, which mean that Yb3+ absorbs a phonon of 22 cm−1 and releases a phonon of 3.0 cm−1, were used to fit the emission spectrum of Yb:YAG at 8-K temperature.

Fifteen variables, including nine transition intensity parameters , two Huang–Rhys factors s, three FWHMs w, and one , are fitted to the emission spectrum and decay time of Yb:YAG. The initial values of are evaluated with point charge model (PCM). The line profile function ϕ is Lorentz function, and the iteration method is the Levenberg–Marquardt method. After 20 iterations, φ = 0.0086, relative residual R is 12.1%, and the calculated decay time is 638 μs, which is very close to experimental value 643 μs. The obtained parameters are listed in Table 1.

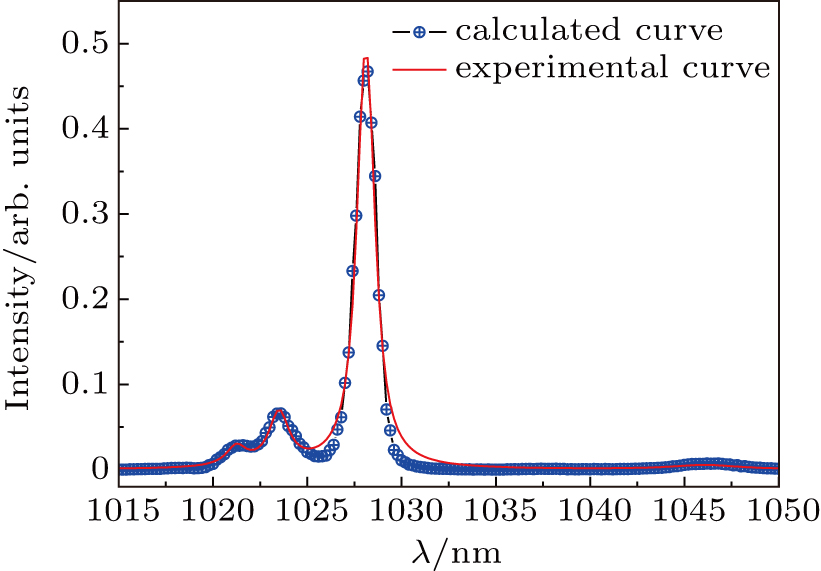
Due to the high dopant concentration, the fluorescence quenching is obvious. According to Ref. [12], the decay time of Yb3+:YAG is 950 μs, and its temperature dependence is not obvious. So the decay time of 950 μs is also used to fit the transition intensity parameters of Yb:YAG again. After 20 iterations, R reaches 12.1%, and the calculated decay time of E5 is 953 μs. Next, the obtained are fixed, and the Huang–Rhys factor, FHWM and are fitted again. The finally obtained values are listed in Table 2, the calculated and experimental emission spectra are shown in Fig. 2. It can be seen that the longer the decay time, generally the smaller the transition intensity parameters are, which results from the case where the decay time is inversely proportional to transition probability AIF, and if magnetic contribution is omitted. Omitting their signs, the ratios of ((k, t, p) = (2,3,2), (4,3,2), (4,5,4), (6,5,4), (4,5,2), (6,5,2), (6,7,6), (6,7,4), (6,7,2)) obtained by fitting with the decay times of 950 μs and 643 μs, are 0.60, 0.93, 0.37, 1.60, 0.83, 0.70, 0.81, 8.97, 0.88, respectively, most of which are close to , which indicates that are approximately inversely proportional to the square root of the decay time, and the precise decay time is important for determining .

Fig. 2. (color online) Calculated and experimental emission spectra of (10 at.%) Yb:YAG at 8 K.
Table 2.

Values of transition probability A, line strength S, fluorescence branch ratio β of Yb3+:YAG at 8 K.

.

The transition probabilities and line strengths of Yb:YAG are listed in Table 2. It can be seen that magnetic dipole transitions are very weak in all of transitions, its total transition probability is 12.3/s, the total electric dipole ratio reaches up to 1050/s, and the ratio of magnetic transition is about 1%. It is surprised that the branch ratio of E5E1 is very large, which is 43.6%, although it is very weak in the observed emission spectrum. The transitions of E5E3 and phonon assisted transition E5E3 + phonon of 3 cm−1with Huang–Rhys factor 0.25, which is usually used as laser channel, account for 29.0% and 16.8%, and their sum is about 45.8%, respectively. So 45.8% should be the possible highest efficiency of a diode-pumped solid state laser by using Yb3+:YAG as a gain medium. On the other hand, during the procedure of E5 + phonon of 22 cm−1 with Huang–Rhys factor 0.33 → E2, Yb3+:YAG can absorb a phonon and emit a higher-energy photon, which will reduce the thermal load during laser operation and result in its good thermal properties and high efficiency.

3.2. Transition intensity fitting of the emission spectrum of Yb:YAG at 300 K

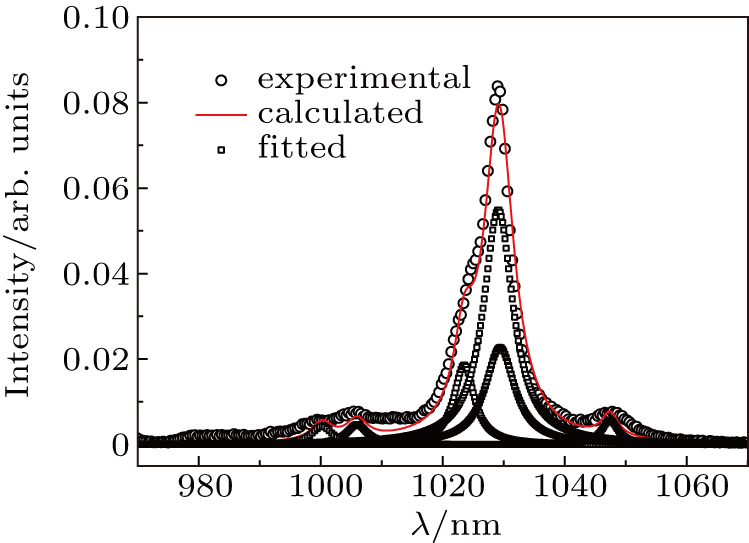
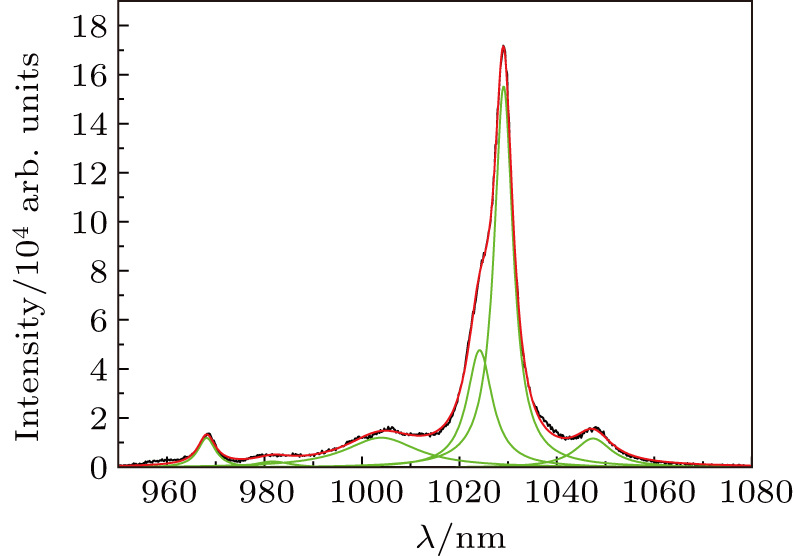
The emission spectrum of (10 at.%) Yb:YAG excited by the light of 914.8 nm is shown in Fig. 3, which can be fitted by seven Lorentz functions, and their FWHMs, centers and areas are shown in Table 3.

Fig. 3. (color online) Emission spectra of (10 at.%) Yb:YAG at 300 K (λex = 914.8 nm).
Table 3.

Fitted results of the room temperature emission spectra of (10 at.%) Yb:YAG with Lorentz profile.

.

The emission band with peak 981 nm should be from the vibronic band of E5E1 of Yb:YAG, and has the same initial state as the emission band with peak 968.1 nm. When the temperature increases, the lattice vibration intensifies, and the corresponding phonon energy should increase. So it is suggested that the emission bands of 1000.8 nm and 1006.5 nm are from the vibronic bands of E5E2, which means that the transition with one-phonon assisted transition at low temperature has turned into two-phonon assisted transitions with energies of 172 cm−1 and 228 cm−1, respectively.

Due to the strong re-absorption near 968 nm, the emission spectrum as shown in Fig. 4, in which the emission band of 968 nm is stripped and not included in fitting. No obvious dependence of decay time on temperature is observed, and it is reasonable to assume that the transition probability of Yb:YAG nearly keeps constant during temperature changing from the low temperature to room temperature. Then values obtained from the emission spectrum of 8 K are used and fixed, and Huang–Rhys factor, FWHM and are fitted to its emission spectrum of 300 K again. The 14 iterations are performed and final R is 11.7%, the decay time of E2 is calculated to be 952 μs and close to the experimental value 950 μs, and the values of s1 and s2, which correspond to the phonon assisted transitions of E5E2 and E3, are 0.129 and 0.006, respectively. The other fitted parameters are listed in Table 4. The fitted curve is shown is Fig. 4, the consistency between the calculated and experimental curves near 100 nm is not so good, which may be due to the fact that only two-phonon assisted transition procedures are considered, more-phonon assisted transitions at room temperature are needed in order to reach good consistency. But the emission bands near 1000 nm are weak, and the present difference between calculated and experimental values is not dominant, so no more-phonon assisted transitions are considered and incorporated into the fitting.

Fig. 4. (color online) Fitted and experimental emission spectra of (10 at.%) Yb:YAG at 300 K (λex = 914.8 nm).
Table 4.

Parameters fitting the emission spectrum of (10 at.%) Yb:YAG at room temperature.

.
Table 5.

Values of transition probability A, line strength S, fluorescence branch ratio β of Yb3+:YAG at 300 K.

.
3.3. Emission cross section of Yb:YAG

Emission cross section is a gain ability parameter of a laser medium and can be used to evaluate its laser performance directly. Because there exists an obvious concentration quenching in (10 at.%) Yb3+:YAG, so its emission cross section is calculated by fitted with the decay time 950 μs. The emission cross section of Yb3+ is calculated by[10]

where c is the light speed in vacuum, n is the refractive index of Yb3+:YAG, A is the transition probability, ϕ(λ) is a normalized profile function, which satisfies the following normalization:
In Eq. (4), ϕ(λ) is a Lorentz function and calculated with FWHM directly.

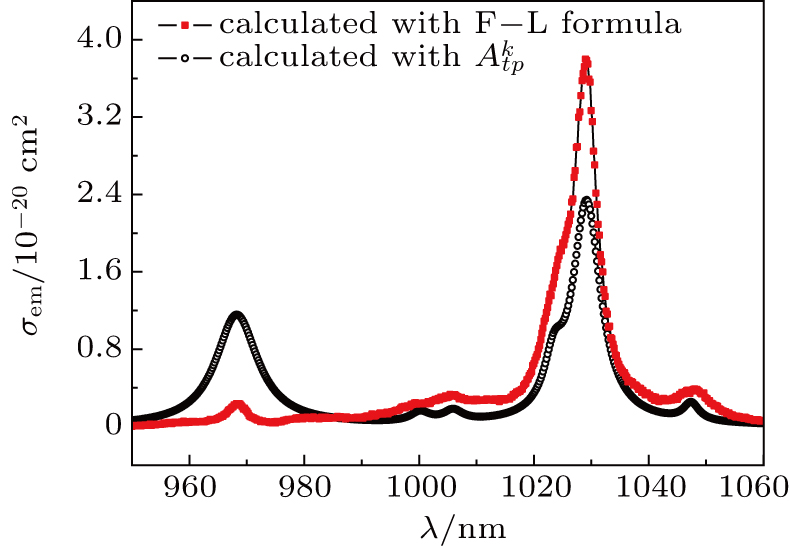
As a comparison, the emission cross section of Yb3+:YAG is calculated by Fuchtbauer–Ladenburg (F–L) equation[7] where τrad is the decay time, and profile function ϕ′(λ) is calculated from emission spectrum I(λ) as follows:

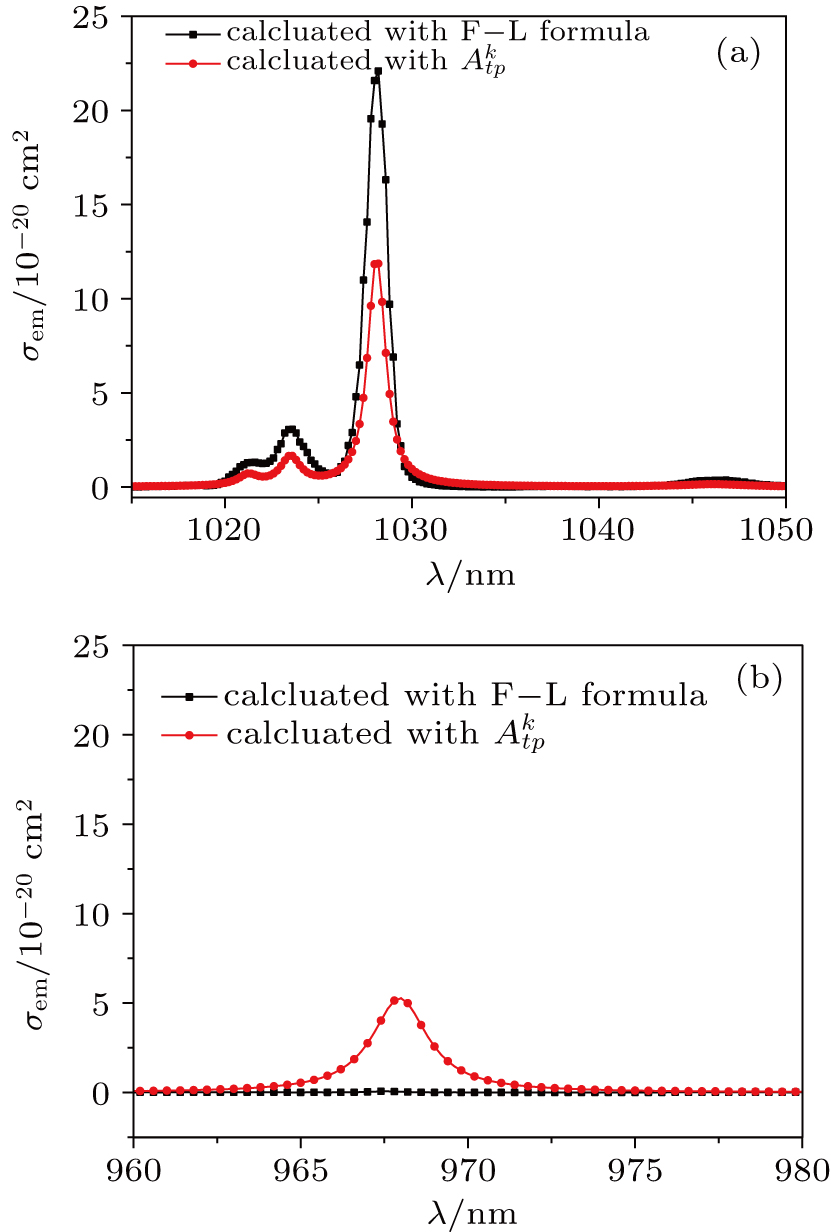
The emission cross sections at 8 K calculated by Eqs. (4) and (6) are shown in Fig. 5 and Table 6. It can be seen that emission cross section from E5E1, with a peak value of 0.07 × 10⁻²⁰ cm2 at 968 nm, calculated by the F–L formula is very close to zero due to the strong re-absorption of Yb3+, but the corresponding value calculated by Eq. (4) with intensity parameters is 5.07 × 10⁻²⁰ cm2. The emission cross sections obtained with the F–L formula at 1021.2 nm, 1023.5 nm, 1028 nm, 1028.3 nm, 1046 nm, which correspond to the transitions E5 + phonon → E2, E5E2, E5E3, E5E3 + phonon, and E5E4, are 1.29, 3.06, 22.09, 21.57, 0.36 in 10−20 cm2, and the corresponding values calculated by intensity parameters and profile functions are 0.81,1.61, 12.04, 11.95, 0.18 in 10−20 cm2. It can be seen that the later values are much less than the former values. According to the emission cross sections of Yb3+:YAG at cryogenic temperatures,[7] the emission cross sections are about 11 × 10−20 cm2 at 80 K, which is close to 12.04 × 10⁻²⁰ cm2 of 1028 nm, and 12.04 × 10⁻²⁰ cm2 of 1028.3 10−20 cm2 at 8 K, respectively, which indicates that our calculated cross sections are reasonable. The overrated cross sections through F–L formula result from the case where the strong reabsorption of E1E5 causes the ∫I(λ)dλ to be underrated, and profile value is overrated in the wavelength at which there exists no reabsorption.

Fig. 5. (color online) Emission cross sections of Yb:YAG, calculated by intensity parameters (a) and F–L formula (b) at 8 K.
Table 6.

Values of emission cross section σem (in 10−20 cm2) of Yb3+:YAG, calculated with and F–L formula at 8 K and 300 K.

.

The emission cross sections at 300 K are also calculated by and F–L formula is shown as in Fig. 6. The emission spectra are broadened as sample temperature increases. Then the profile function peak values decrease, and the cross section peak values also decrease. For example, the fitted FWHMs of E5E2, E3 are 0.61 nm and 0.52 nm at 8 K and 2.05 nm and 2.94 nm at 300 K, and the cross sections calculated with are 1.61 and 12.04 in 10−20 cm2 at 8 K, and 1.03 and 2.33 in 10−20 cm2 at 300 K, respectively.

Fig. 6. (color online) Emission cross sections of Yb:YAG at 300 K.
3.4. Transition intensity parameters Ωt of Yb:YAG

According to Judd–Ofelt triple parameter intensity formula, if the crystal field energy level splitting is omitted, the dipole transition line strength of 2F5/22 F7/2 can be calculated by

where Ωt can be calculated with directly, U(t) is the single electron operator, Ω2,4,6 = 0.20, 2.45, 1.86 in 10−20 cm2. With the values of 〈2F7/2U(t)2F5/2〉,[9] Sed is calculated to be 3.4 × 10⁻²⁰ cm2, which is much higher than 0.514 × 10⁻²⁰ cm2 obtained from the fitting to emission spectrum of Yb3+:YAG, and is similar to the case of Yb3+:GdTaO4. This indicates that triple parameter intensity formula is unsuitable for rare-earth ion transition at the cryogenic temperature again.

In summary, the emission spectrum of Yb3+:YAG at 8 K consists of four pure electron state transitions and two-phonon assisted transitions, one vibronic transition releases a phonon, and the other vibronic transition absorbs a phonon in the frame of the single frequency approximation. In the emission spectrum at 300 K, there exist one vibronic transition releasing a phonon, and two vibronic transitions absorbing a phonon. The optical transition procedure absorbing phonon can reduce the thermal load of Yb3+:YAG and improve its thermal management. Emission cross sections determined by F–L formula are remarkably different from those calculated by , F–L formula underrates the emission cross sections in a reabsorption wavelength region, and overrates emission cross sections in other wavelength regions.

4. Conclusions

Transition intensity parameters and Huang–Rhys factor are fitted to the emission spectrum of Yb3+:YAG by the full-profile fitting method. The emission spectrum of Yb3+:YAG at cryogenic temperature consists of three pure electron state transitions and two- or three-phonon assisted transitions, one vibronic transition releases phonon, and the other one or three vibronic transitions absorb phonon in the frame of the single frequency approximation, the later procedure can reduce the thermal load of Yb3+:YAG and improve its thermal management, which may be one of the reasons why the Yb3+:YAG is an excellent high-average power laser medium. Emission cross sections determined by F–L formula are remarkably different from those calculated with , F–L formula underrates emission cross section which is nearly equal to zero in the reabsorption wavelength region, and overrates remarkably emission cross section in the other wavelength region, which suggests that it is necessary for Yb-doped laser medium to determine intensity parameters in order to evaluate a proper laser performance. The emission bands of Yb:YAG are broadened thermally, which results in the emission cross section peak values at 300 K being much less than those at 8 K.

Reference
[1] Rutherford Todd S William Tulloch M Gustafson Eric K Robert L 2000 IEEE J. Quantum Electron. 36 205
[2] Hans Bruesselbach David Sumida S 2005 IEEE J. Sel. Top. Quantum Electron. 11 600
[3] Chanteloup J C Bahbah S Bourdet G Dambrine C Huang Z Le S Le G Pluvinage M Vincent B Yu H 2006 2006 Conf. Lasers Electro- Opt. 2006 Quantum Electronics and Laser Science Conference 1
[4] Sekine T Takeuchi Y Hatano Y Muramatsu Y Kurita T Morita T Mizuta Y Kabeya Y Kurata M Kawai K Iguchi T Tamaoki Y Iyama K Zheng Y Kato Y 2017 2017 Conf. Lasers Electro-Opt. (CLEO) 1
[5] Krüger M Münzer A Kessel A Lysov O Leshchenko V E Trushin Sergei A Major Z Krausz F Karsch S 2017 Conference on Lasers and Electro-Optics Europe & European Quantum Electronics Conference (CLEO/Europe-EQEC) 1
[6] Li M Zhou T Xu L Gao Q Hu H Wu Y Wang D Li J Lei J Lv W Yu Y Wu Z Zhao N 2017 IEEE Photon. J. 1507109
[7] Patel Falgun D Honea Eric C Joel Speth Payne Stephen A Ralph Hutcheson Randy Equall 2001 IEEE J. Quantum Electron. 37 135
[8] Zhang Q L Ning K J X J Ding L H Zhou W L Liu W P Yin S T Jiang H H 2010 Chin. Phys. 19 087501
[9] Zhang Q L Sun G H Ning K J Shi C S Liu W P Sun D L Yin S T 2016 Chin. Phys. 25 117802
[10] Zhang Q L Sun G H Gao J Y Sun D L Luo J Q Liu W P Zhang D M Shi C S Yin S T 2017 Chin. Phys. 26 077803
[11] Wang X M Wang X F Zhang Q L 2015 J. Synthetic Crystals 44 1465
[12] Korner J Jambunathan V Hein J Seifert R Loeser M Siebold M Schramm U Sikocinski P Lucianetti A Mocek T Kaluza M C 2014 Appl. Phys. 116 75