Frequency response range of terahertz pulse coherent detection based on THz-induced time-resolved luminescence quenching*

Project supported by the Wuhan Applied Basic Research Project, China (Grant No. 20140101010009), the National Natural Science Foundation of China (Grant Nos. 61405063, 61475054, 11574105, and 61177095), the Hubei Science and Technology Agency Project, China (Grant No. 2015BCE052), and the Fundamental Research Funds for the Central Universities, China (Grant No. 2017KFYXJJ029).

Zhang Man, Yang Zhen-Gang, Liu Jin-Song, Wang Ke-Jia, Gong Jiao-Li, Wang Sheng-Lie
School of Optical and Electronic Information, Wuhan National Laboratory for Optoelectronics, Huazhong University of Science and Technology, Wuhan 430074, China


† Corresponding author. E-mail: mikleyang@163.com

Project supported by the Wuhan Applied Basic Research Project, China (Grant No. 20140101010009), the National Natural Science Foundation of China (Grant Nos. 61405063, 61475054, 11574105, and 61177095), the Hubei Science and Technology Agency Project, China (Grant No. 2015BCE052), and the Fundamental Research Funds for the Central Universities, China (Grant No. 2017KFYXJJ029).

Abstract

It has been proposed previously that the coherent detection of a terahertz (THz) pulse can be achieved based on the time-resolved luminescence quenching. In this paper, we investigate the frequency response range of this novel detection technology by simulating the motion of carriers in gallium arsenide (GaAs) by the ensemble Monte Carlo method. At room temperature, for a direct-current (DC) voltage of 20 kV/cm applied to the semiconductor (GaAs) and sampling time of 140 fs, the luminescence quenching phenomena induced by terahertz pulses with different center frequencies are studied. The results show that the quenching efficiency is independent of the THz frequency when the frequency is in a range of 0.1 THz–4 THz. However, when the frequency exceeds 4 THz, the efficiency decreases with the increase of frequency. Therefore, the frequency response range is 0.1 THz–4 THz. Moreover, when the sampling time is changed to 100 fs, the frequency response range is extended to be approximately 0.1 THz–5.6 THz. This study of the frequency-dependent characteristics of the luminescence response to the THz pulse can provide a theoretical basis for the exploration of THz detection technology.

1. Introduction

A terahertz (THz) wave is an electromagnetic wave with a frequency range from 0.1 THz to 10 THz, which is located between microwave and the far infrared. The wavelength, wave number, and energy of a 1-THz photon are 300 μm, 33.3 cm−1, and 4.14 meV,[1,2] respectively. The continuous progress of THz technology has led to the gradual expansion of its applications, making the detection of terahertz pulses a key issue. THz detection technology can be divided into two types: incoherent detection and coherent detection. For example, Bolometers, pyroelectric detectors and Golay cells are incoherent detection techniques, which are used to detect the radiation of terahertz wave.[3] Electro-optic (EO) sampling,[3] antenna detection,[4,5] and heterodyne detector[3] are coherent detection techniques, and they have the ability to detect the electric field of THz pulse. In practical applications, the detection technology can be selected according to the specific circumstances. In order to enhance the performance and functionalities of the detectors for various applications, a novel theoretical THz pulse detection method was proposed in a previous study.[6]

The electron transport caused by a THz pulse has aroused significant interest,[610] which is the basis of the new detection theory. In our earlier work, it has already been suggested that the coherent detection of THz pulses can be realized based on the THzinduced time-resolved luminescence quenching,[6] because the changes in the luminescence and THz pulse waveforms are reversed when the THz pulse irradiates the semiconductor under a direct-current (DC) voltage at room temperature. In this paper, we theoretically investigate the frequency response range of this new detection method. The time-domain spectra and frequency spectra of luminescence for terahertz pulses with different center frequencies are obtained by using the ensemble Monte Carlo method, which are then compared with the corresponding time-domain spectra and frequency spectra of the incident terahertz pulses. This comparison enables the study of the frequency-dependent characteristics of the luminescence response to the THz pulse. This paper improves the theoretical approach to the new detection technology, thus guiding future experiments.

2. Physical mechanism and model

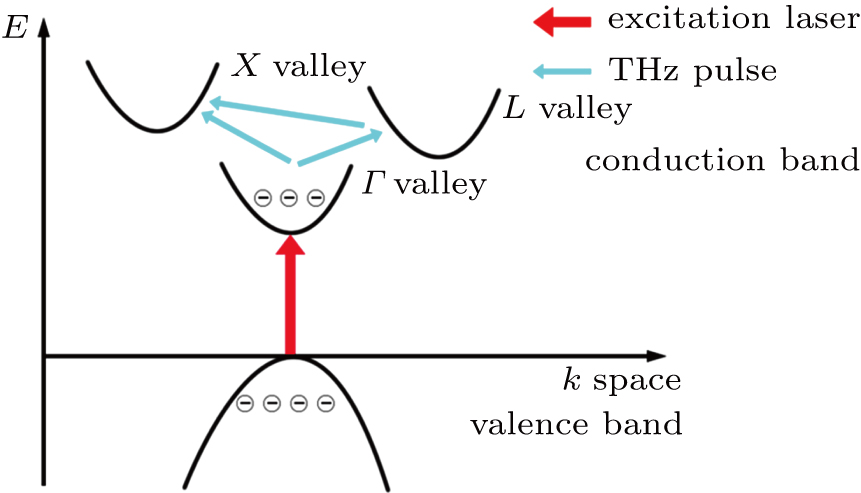
As shown in Fig. 1, there are Γ valley, L, and X valleys in the conduction band of GaAs. The ΓL separation energy ΔEΓL is 0.29 eV, and the LX separation energy ΔELX is 0.23 eV. When an excitation beam irradiates GaAs, the electrons at the top of the valence band absorb photon energy and transfer to the bottom of the Γ valley. Simultaneously, holes emerge at the top of the valence band. The electrons in the Γ valley will then transfer back to the valence band and reunite with the holes. In this process, each electron releases a photon leading to the observed luminescence. When the GaAs is irradiated with a THz pulse, the incident THz pulse offers energy to the electrons in the Γ valley, which can transfer them to the L valley, or even to the X valley if the energy is high enough. These electrons cannot participate in Auger recombination, and consequently cannot produce luminescence either, leading to luminescence intensity decreasing, which is referred to as THz-induced luminescence quenching. The luminescence intensity is directly proportional to the number of electrons in the Γ valley, which has been demonstrated in previous studies.[6,1114]

Fig. 1. (color online) Illustration of THz pulse effect.

To investigate the distributions of the electrons in the three valleys corresponding to different incident THz pulses, the Boltzmann equation is used to describe the motion of electrons in the THz field, which is studied by the ensemble Monte Carlo method[9,10,1523]

where fk is the distribution function of the electrons, is the generation rate of the light-induced electrons, and are the interaction rates of electron-phonon and electron–impurity, respectively. The effect of the incident THz pulse is described by , where e is the charge of a single electron and h is the Planck constant divided by 2π; Et = (2Y0ETHzJd)/(Y0 + Ys) is the THz field transmitted through the thin semiconductor film,[24] where d is the excitation penetration depth, ETHz is the incident THz pulse, Y0 and Ys are the admittances of vacuum and the sample, respectively.

The electron distribution fk can be obtained by solving Eq. (1), which corresponds to the luminescence spectrum in the time domain. The luminescence frequency spectrum can be achieved via the Fourier transform of the its time-domain spectrum. The frequency response range from the luminescence to the terahertz pulse can be obtained by comparing the frequency spectra of the luminescence and THz pulse. fk is the number of electrons in the Γ valley, and is used to represent the intensity of the luminescence.[6] The quenching efficiency of luminescence is directly affected by the number of electrons transferring from Γ valley to L valley or X valley.

3. Results and discussion

The center wavelength of the excitation laser is 800 nm, whose photon energy is 1.54 eV, which is slightly higher than the band gap of GaAs (1.45 eV). Therefore, the energy of the excited electrons is about 0.09 eV when they arrive at the bottom of the Γ valley, which is much lower than the ΔEΓL. The room temperature is 300 K, and the threshold voltage of the luminescence quenching response to an external electric field is 20 kV/cm.[6] The sampling time should be in a range of 100 fs–200 fs,[6] because the quenching phenomenon is unobvious when the sampling time is too short, whereas it can easily appear as nonlinearity when the sampling time is too large. In this simulation, the DC field is set to be 20 kV/cm, while the sampling time is set to be 140 fs. Under these conditions, the electrons in the Γ valley can just be driven to the L valley, but not to the X valley. Simultaneously, the weak part of the THz pulse can also trigger responses.

The luminescence quenching efficiency is calculated from

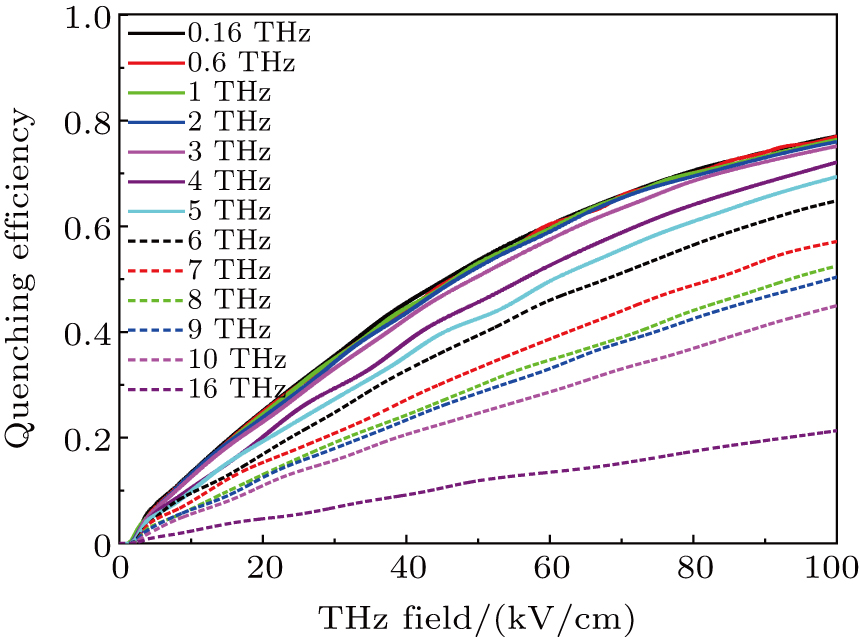
where nTHz≠0 is the number of electrons in the Γ valley when the intensity of the THz pulse reaches a maximum value, whereas nTHz=0 is the number of electrons in the Γ valley without THz pulse irradiation. By changing the maximum intensity of the THz pulse and calculating the corresponding value of α, the relationship between quenching efficiency α and THz intensity ETHz can be obtained. This calculation is performed for a series of THz pulses with different center frequencies, and the results are shown in Fig. 2.

Fig. 2. (color online) Quenching efficiencies of luminescence with different THz pulses, their center frequencies ranging from 0.16 THz to 16 THz, and the pulse peak values changing from 0.1 kV/cm to 100 kV/cm.

The quenching efficiency curves corresponding to 0.16, 0.6, 1, 2, and 3 THz almost coincide with each other, which implies that the quenching efficiency is independent of the frequency in the low-frequency region. In comparison, the curves corresponding to 4, 5, 6, 7, 8, 9, 10 THz, and 16 THz show that the quenching efficiency decreases with the increase of the frequency.

The ITHz and IPL denote the intensities of the THz pulse and luminescence, respectively. The luminescence intensity can be expressed as a sum of two terms:

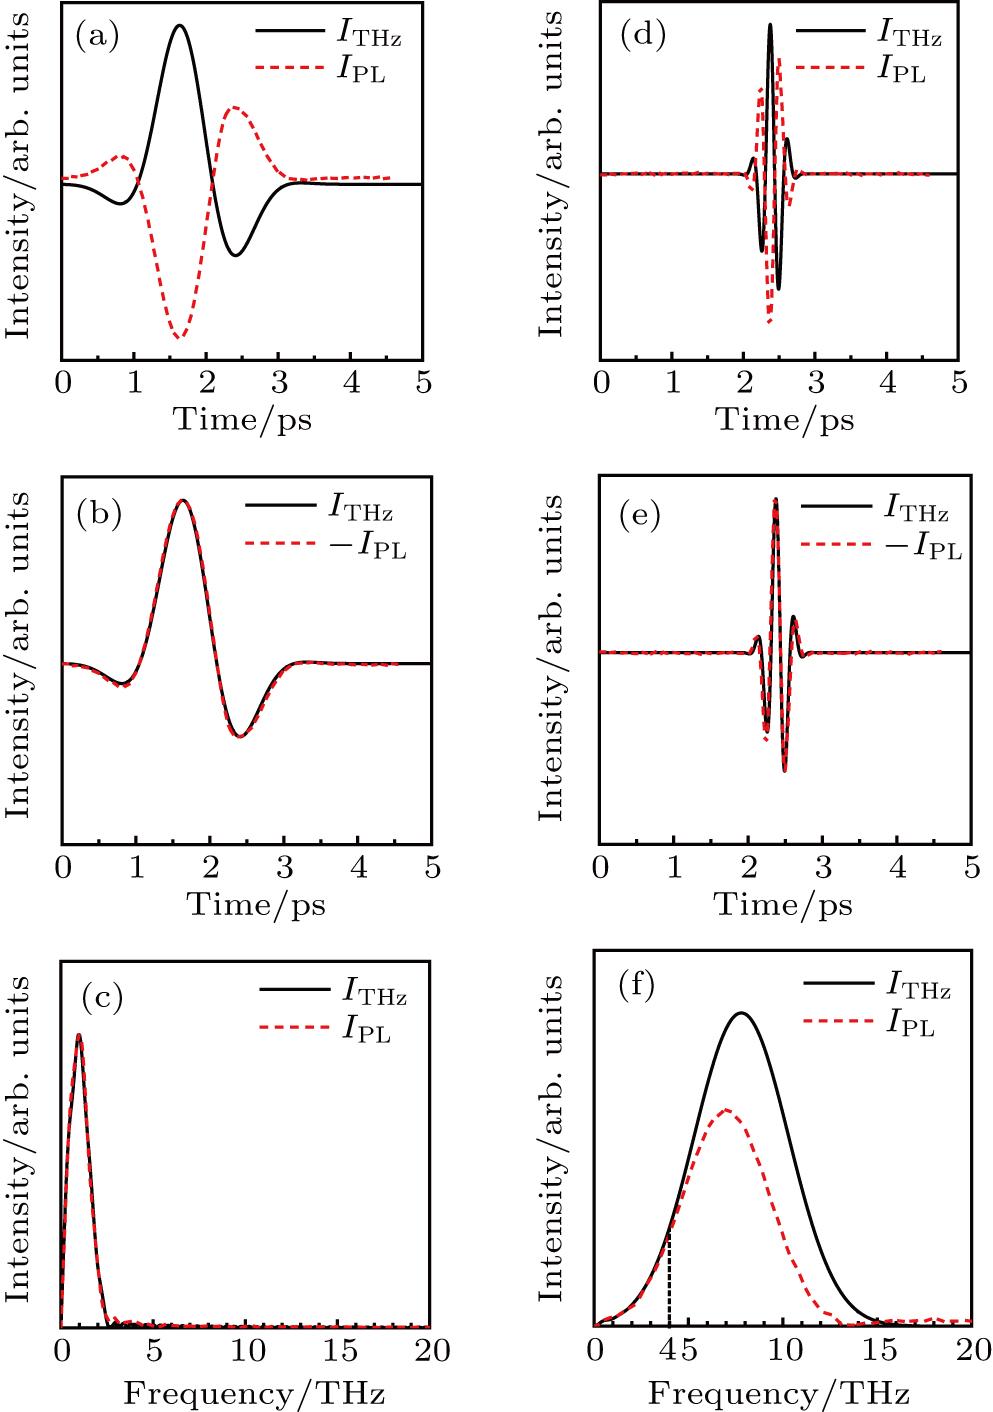
where I0 is the luminescence intensity without the THz pulse, and ΔIPL is the change of the luminescence intensity induced by the THz pulse. In Eq. (3), I0 is a constant, so the change of ΔIPL can be regarded as that of IPL. Terahertz pulses with different center frequencies are compared with each other; the corresponding luminescence intensities are presented in the time and frequency domains. Figure 3 shows the results for frequencies of 1 THz and 8 THz. The peak of the THz pulse corresponds to 20 kV/cm, which is in the linear range of the luminescence quenching response to the external field. All intensities are normalized.

Fig. 3. (color online) Comparison between the THz pulse and luminescence intensities in the time and frequency domains, Showing (a) ITHz and IPL in the time domain, (b) ITHz and –IPL in the time domain, and (c) ITHz and IPL in the frequency domain are presented, all for 1 THz; (d) ITHz and IPL in the time domain, (e) ITHz and –IPL in the time domain, and (f) ITHz and IPL in the frequency domain, all for 8 THz.

Figures 3(a) and 3(c) show the comparisons between the ITHz and IPL in the time domain and those in frequency domain of the THz pulse with a center-frequency of 1 THz, respectively. In the time domain, the luminescence waveform is exactly opposite to the incident THz pulse waveform, whereas in the frequency domain, the luminescence waveform and incident-THz-pulse waveform well coincide with each other. Figure 3(b) shows that the curves of ITHz and –IPL coincide with each other in the time domain. These results show that the luminescence quenching efficiency, induced by the THz pulse, is independent of THz pulse frequency in the low-frequency range. In order to obtain the frequency response range, a broader-band THz pulse is needed. Figures 3(d) and 3(f) show the comparisons between ITHz and IPL in the time domain and those in frequency domain for a THz pulse with a center-frequency of 8 THz, respectively. In the time domain, the luminescence pulse is slightly broader than the THz pulse. In the frequency domain, the luminescence spectrum significantly differs from that of the THz pulse. When the frequency is lower than approximately 4 THz, they overlap; however, for higher frequencies, the frequency spectrum intensity of the luminescence is significantly lower than that of the THz pulse. Moreover, in Fig. 3(e), the curves of ITHz and –IPL do not fully coincide. The time-domain spectrum of the luminescence is wider than that of the THz pulse, which is most likely to be due to the higher ratio of the low-frequency component of the luminescence. These results show that the time-domain spectrum of this broadband THz pulse cannot be obtained through the time-domain spectrum of the corresponding luminescence. In addition, the frequency spectrum of the luminescence does not fully reflect the information about the incident THz pulse in the frequency domain.

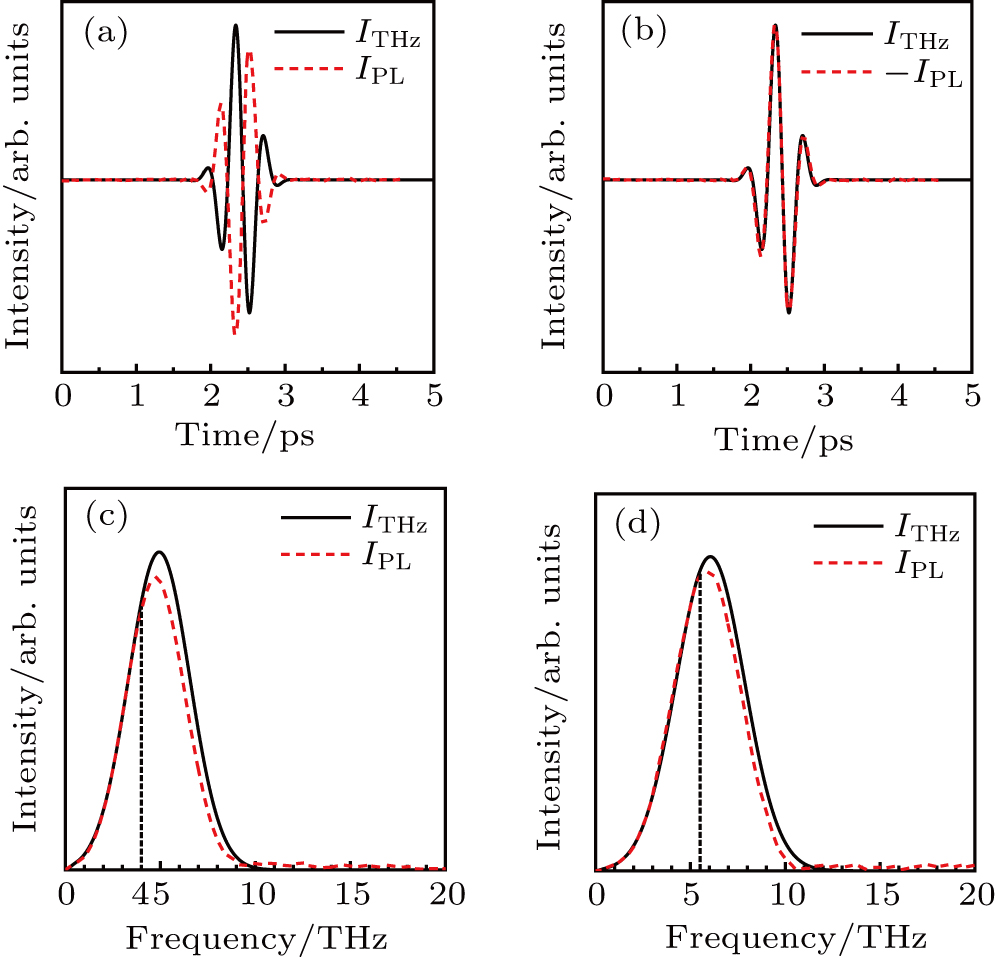
To verify the above results, figure 4 shows the results for a THz pulse with a center-frequency of 5 THz. Figure 4(c) shows that the spectra of the luminescence and THz pulse almost coincide in a range of 0 THz–4 THz, whereas the intensity of the luminescence is lower than that of the THz pulse when the frequency is higher than 4 THz. This result is consistent with that in Fig. 3(f).

Fig. 4. (color online) (a) ITHz and IPL in time domain, (b) ITHz and –IPL in time domain, and (c) ITHz and IPL in frequency domain, all for 5 THz pulse with a sampling time of 140 fs; (d) ITHz and IPL in frequency domain for a THz pulse with a center-frequency of 6 THz and a sampling time of 100 fs.

Based on those analyses, it is proposed that the frequency response range be approximately 0.1 THz–4 THz, when the DC field is 20 kV/cm and sampling time is 140 fs. In this case, the quenching efficiency of luminescence induced by the THz pulse is independent of frequency. However, when the frequency is higher than 4 THz, the efficiency decreases with the increase of frequency.

The optical power P can be calculated from

where E is the energy, t is the sampling time, N is the number of photons, and is the photon energy. Therefore, the energy received in a given time interval can be calculated from
When t = 140 fs and ν = 4 THz, E can be calculated to be proportional to 0.232 eV, i.e., E ∝ 0.232 eV, according to Eq. (5). The LX separation energy ΔELX of GaAs is 0.23 eV. Therefore, the 4 THz photons can provide enough energy to transfer the electrons not only to the L valley, but also to the X valley. The latter scattering mechanism needs more energy, leading to a reduction in the quenching efficiency. Equation (5) also shows that the number of photons affects the quenching efficiency. The THz pulses with a high center frequency contain more high-frequency components, and less low-frequency components. In addition, a high-frequency photon has a higher energy than a low-frequency photon, which implies that at the same optical power, the number of high-frequency photons is smaller than that of low-frequency photons. Therefore, for the same peak value, the THz pulse with a higher center frequency contains fewer photons, which could lead to the decrease of quenching efficiency.

According to the above analysis, t is another important parameter that can affect the quenching efficiency. For further investigation, the sampling time is changed to 100 fs, and the center frequency of THz pulse is 6 THz. Figure 4(d) shows the comparison of ITHz and IPL in the frequency domain. It clearly shows that the quenching efficiency begins to decrease at the frequency of approximately 5.6 THz. For t = 100 fs and ν = 5.6 THz, E ∝ 0.231 eV can be obtained according to Eq. (5), which is slightly higher than the value of ΔELX. Above all, for different THz pulses and sampling times, the theoretical analyses and the simulation results are consistent well with each other, which implies that our obtained results are reasonable.

4. Conclusions

In this paper, we have theoretically studied the frequency characteristics of a THz-induced time-resolved luminescence quenching in GaAs based on the ensemble Monte Carlo method to obtain the frequency response range of the THz-pulse coherent detection method. For a DC field of 20 kV/cm applied to the semiconductor (GaAs) and sampling time of 140 fs, at room temperature (300 K), the luminescence quenching induced by THz pulses with different center frequencies is studied. The results show that from 0.1 THz to approximately 4 THz, the quenching efficiency is independent of frequency, whereas from 4 THz to 10 THz, the quenching efficiency decreases with the increase of frequency. That means that in a frequency range of 0.1 THz–4 THz, the spectra of luminescence and the incident THz pulse are coincident, whereas in the higher frequency region, the spectra of luminescence and the incident THz pulse are not coincident. When the sampling time is reduced to 100 fs, this range is expanded to 0.1 THz–5.6 THz. Therefore, it can be concluded that for a DC field of 20 kV/cm and sampling time of 140 fs, the frequency response range of the THz-pulse coherent detection based on semiconductor (GaAs) time-resolved luminescence quenching is approximately 0.1 THz–4 THz, and that the range could be expanded by reducing the sampling time. This paper provides a theoretical basis for the new terahertz coherent detection technology, which will be helpful in the future research.

Reference
[1] Zhang C Zhang Y Zhao G 2008 Terahertz sensing and Imaging Beijing National Defense Industry Press in Chinese
[2] Lee Y S 2008 Principles of Terahertz Science and Technology New York Springer
[3] Xu J Zhang X 2007 Terahertz Technology and Application Beijing Peking University Press in Chinese
[4] Dai J Xie X Zhang X 2006 Phys. Rev. Lett. 97 103903
[5] Karpowicz N 2008 Appl. Phys. Lett. 92 011131
[6] Chu Z Liu J Wang K 2012 Opt. Lett. 37 1433
[7] Hirori H Nagai M Tanaka K 2010 Phys. Rev. B 81 081305
[8] Du L Li Q Li S X Hu F R Xiong X M Li Y F Zhang W T Han J G 2016 Chin. Phys. B 25 027301
[9] Zhou W Ji K Chen H M 2017 Acta Phys. Sin. 66 05421 in Chinese
[10] Gong J L Liu J S Chu Z Yang Z G Wang K J Yao J Q 2016 Chin. Phys. B 25 100203
[11] Rota L Lugli P Elsaesser T Shah J 1993 Phys. Rev. B 47 4226
[12] Shah J Devaud B Damen T Tsang W Cossard A Lugli P 1987 Phys. Rev. Lett. 59 2222
[13] Elsaesser T Shah J Rota L Lugli P 1991 Phys. Rev. Lett. 66 1757
[14] Schoenlein R Lin W Brorson S Ippen E Fujimoto J 1988 Solid State Electron 31 443
[15] Morkoc H 2009 Handbook of Nitride Semiconductors and Devices, GaN-based Optical and Electronic Devices New York Wiley
[16] Jacoboni C Lugli P 1989 The Monte Carlo Method for Semiconductor Device Simulation New York Springer
[17] Jacoboni C Reggiani L 1983 Rev. Mod. Phys. 55 645
[18] Brennan K 1999 The Physics of Semiconductors with Applications to Optoelectronic Devices Cambridge Cambridge University Press
[19] Lugli P Bordone P Reggiani L Rieger M Kocevar P Goodnick S M 1989 Phys. Rev. B 39 7852
[20] Collins C Yu P 1983 Phys. Rev. B 27 2602
[21] Mickevicius R Reklaitis A 1987 Solid State Commun. 64 1305
[22] Mickevicius R Reklaitis A 1990 J. Phys.: Condens. Matter 2 7883
[23] Chu Z Liu J Liu J 2012 Appl. Phys. B 109 113
[24] Su F H Blanchard F Sharma G Razzari L Ayesheshim A Cocker T L Titova L V Ozaki T Kieffer J C Morandotti R Reid M Hegmann F A 2009 Opt. Express 17 9620