Generation of narrowband Lamb waves based on the Michelson interference technique
Ye Tian-Ming, Xu Yan-Feng, Hu Wen-Xiang
Institute of Acoustics, Tongji University, Shanghai 200092, China


† Corresponding author. E-mail: wxhu@tongji.edu.cn

Abstract

An optical method of generating narrowband Lamb waves is presented. It is carried out with a laser line array in a thermoelastic regime implemented by the Michelson interference technique, where the formed array element spacing can be flexibly and conveniently changed to achieve selective mode excitation. In order to simulate the displacement response generated by this array, its intensity distribution function is presented to build a theoretical analysis model and to derive the integral representation of the displacement response. The experimental device and measuring system are built to generate and detect the Lamb waves on a steel plate. Numerical calculation results of narrowband Lamb wave displacement signals based on the theoretical model show good agreement with experimental results.

1. Introduction

Guided waves are widely used in industrial inspection tasks due to their unique characteristics suitable for large area and long distance testing.[13] However, due to their nature of dispersion and multi-modes, Lamb wave signals are often very complicated, which makes them hard to be utilized. Selective generation methods, such as the comb transducer[46] and the angular beam transducer,[7,8] can generate the narrowband and single mode Lamb waves. But these methods need a coupler, which is not suitable in some hostile environments. In those cases, the laser-generated guided wave has become increasingly popular in nondestructive testing (NDT).[9,10] Lamb wave signal generated by pulsed laser is of broadband and multi-mode. In order to excite a narrowband and single mode Lamb wave, some comb transducer-like techniques have been proposed to produce laser line arrays. The current and popular methods proposed for laser line array generation use lenticular arrays[11,12] and the slit mask technique.[1315] The lenticular array or slit mask technique is relatively easy and effective to implement, but the element spacing is fixed and the very small spacing may be not technically feasible due to the limitation of manufacturing method, which may restrict the applications of these methods. In this paper, we propose to use Michelson interference technique to produce the laser line array in which its element spacing is variable. A beam splitter and two good quality plane mirrors are used to build up this device and the different array element spacings can be produced by only changing the angle between two mirrors. The advantage of this technique is that the element spacing can be flexibly adjusted to achieve the selective Lamb wave mode excitation.

In order to study and implement this kind of laser line array excitation, the properties of the intensity distribution for original laser beam and array generated by Michelson interference fringe are analyzed. The theoretical analysis for the displacement field excited by this array is conducted to simulate guided wave mode generation. An experimental device and a measuring system are built to implement the generation and detection of the narrowband Lamb wave on a steel plate. Numerical calculation based on the theoretical model is carried out and the results are confirmed by experimental results.

2. Adjustable laser line array generated by the Michelson interference technique and its properties
2.1. Implementation of the laser line array

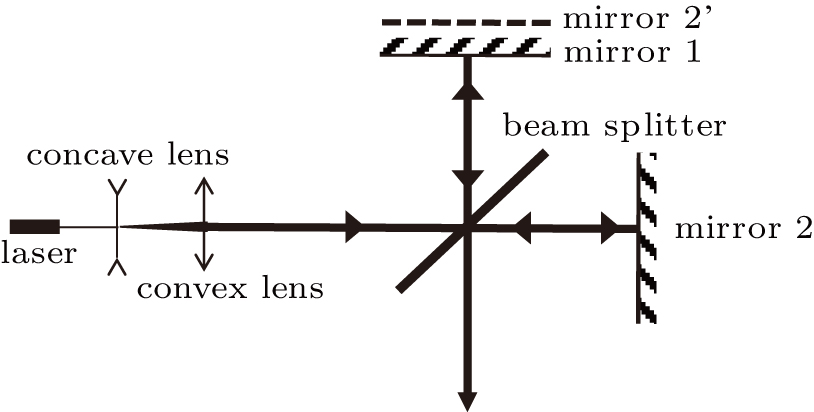
A schematic diagram of the Michelson interference device is shown in Fig. 1. To form an adjustable laser array which can be used to generate the narrowband guided wave modes flexibly, a concave lens is used to expand the original laser beam and a convex lens is used to collimate the expanded beam and to form a parallel light, which are then divided into two beams. Later, the two divided beams are reflected by mirrors 1 and 2 and return to the beam splitter. Finally, the two beams interfere, and the interference fringes are generated. By producing a small angle between mirror 1 and mirror 2’, straight parallel fringes can be formed. The fringe spacing d can be adjusted by only changing this angle, and the parameter d can be written as[16]

where λlaser is the laser wavelength and θ is the angle between mirror 1 and mirror 2’, where mirror 2’ is the image of mirror 2 in the beam splitter. Here we make approximation of in Eq. (1) by using θ since they are nearly equivalent when θ is small.

Fig. 1. Schematic diagram of the Michelson interference device.
2.2. Intensity distribution of the interference fringe and its spatial spectrum

The laser array generated by the Michelson interference technique is nonuniform, and the central lines are stronger than the outer lines due to the Gaussian spatial intensity distribution of the original laser beam. This distribution can be approximately expressed as[12]

where the standard deviation with Dbeam being the illumination area of the laser beam, is the mean of the intensity distribution along the x direction, and .

Based on the interference principle,[16] the intensity distribution of interference caused by two coherent and equal irradiant beams is often considered as the pattern. Thus the distribution function of the interference fringe can be written as

where I0 is the maximum value of the laser beam light intensity, d is the fringe spacing, and F(x) is the spatial intensity distribution of the original laser beam mentioned above.

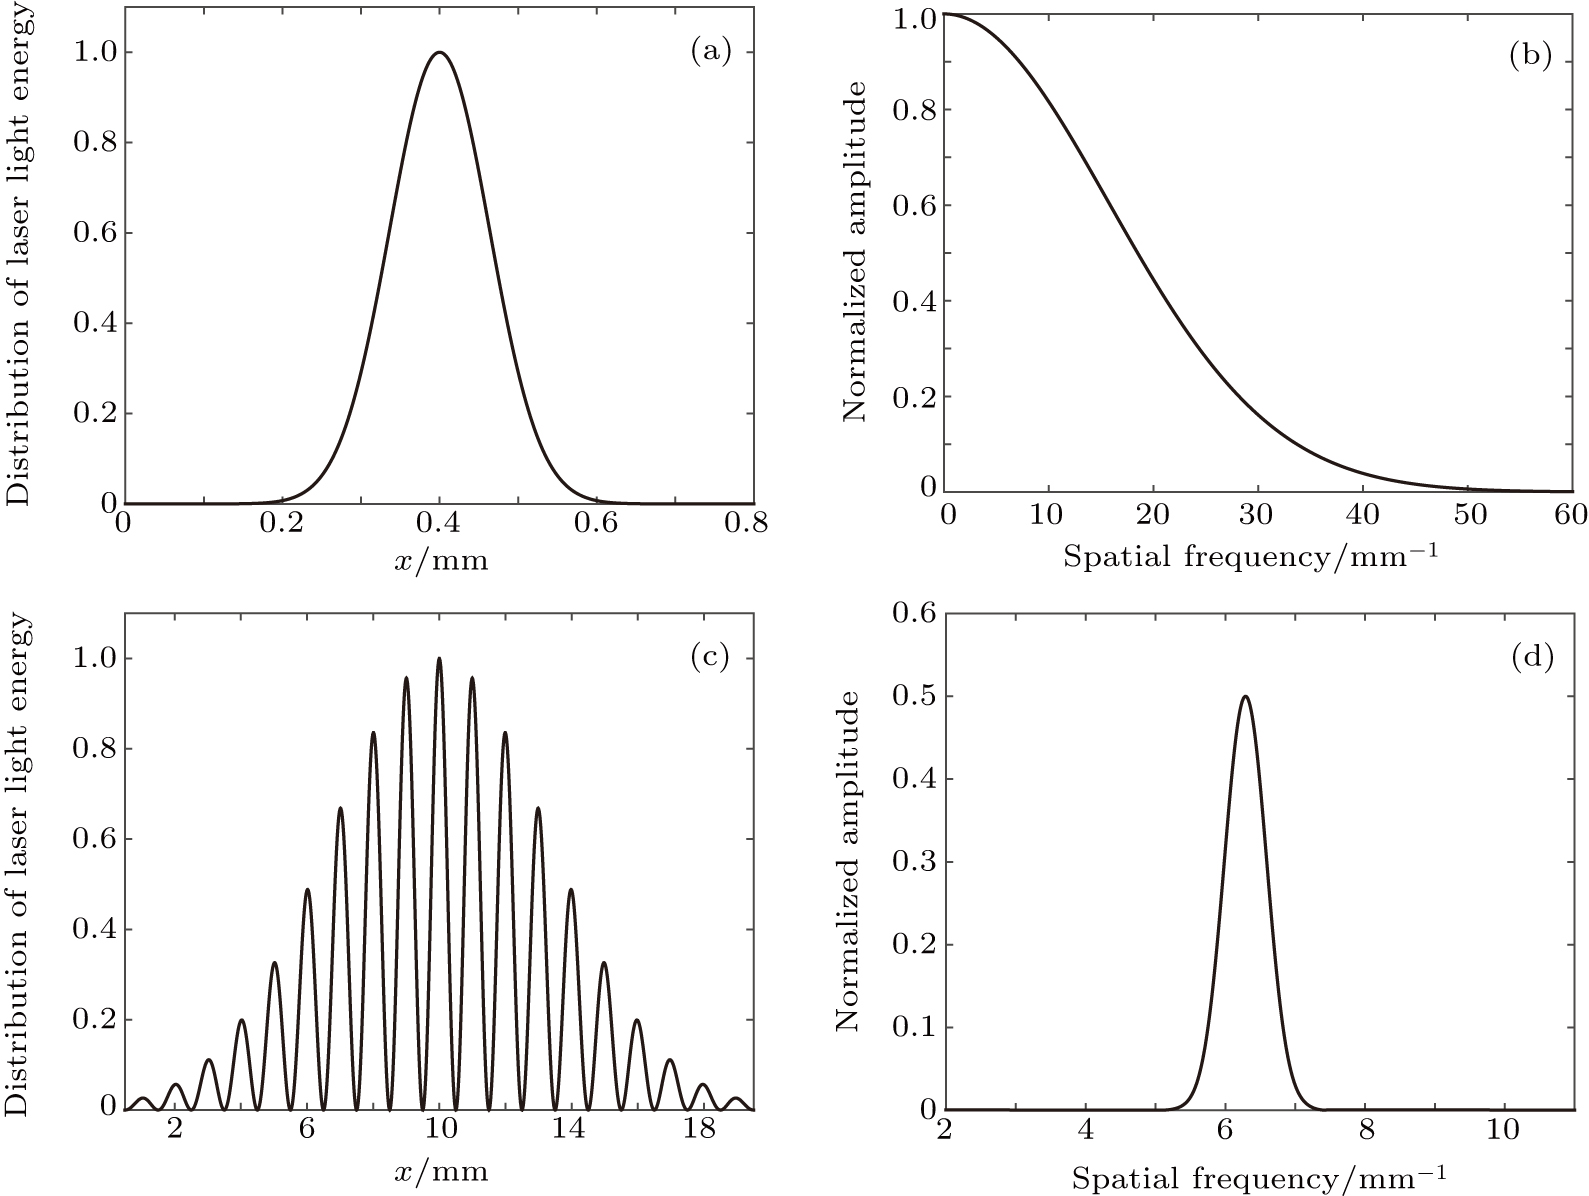
The narrowband signals generated by a laser line array produced by The Michelson interference technique can be characterized as the spatial modulation method. For a single line source, its spatial bandwidth is broadband. But a periodically spaced line array can function as a transversal filter, which will effectively reduce the spatial bandwidth. Assuming that a laser line source has an intensity of Gaussian distribution with a full width at half maximum (FWHM) of 0.15 mm as shown in Fig. 2(a), the corresponding spatial spectrum is shown in Fig. 2(b). But for a spatial array including 19 elements with an 1 mm spacing, produced by the Michelson interference technique shown in Fig. 2(c), its spatial spectrum shown in Fig. 2(d) is quite different, in which the energy is concentrated into the desired wavenumber to generate a corresponding narrowband guided wave signal, whereas its wavelength is equal to the element spacing. The width of the spatial spectrum can be reduced by increasing the number of the array elements and the peak position in spatial frequency can be adjusted through changing the element spacing.

Fig. 2. (a) Intensity distribution of laser line source and (b) spatial spectrum of this line source. (c) Intensity distribution of laser array with 19 elements generated by the Michelson interference technique and (d) spatial spectrum of this laser array.
3. Theoretical analysis and numerical approach

Considering a homogenous and isotropic plate, its thickness is 2h. The laser line array in the thermoelastic regime impacts at the upper surface of the plate. The model used in this section is shown in Fig. 3.

Fig. 3. Laser line array impacting at the surface of an isotropic plate.

The displacement vector can be calculated according to the Helmhotlz decomposition

The potentials φ and ψ satisfy the wave equations
where cL and cT are the velocities of the longitudinal wave and the transverse wave, respectively.

For a laser array source in thermoelastic regime mentioned above, the boundary conditions of two surfaces for a plate can be given as

where and are the tangential and normal stresses respectively, is a constant, is the derivative of the Dirac function, is the laser pulse function which can be represented as [17] with τ being the rise time of the laser pulse, and is the intensity distribution function of interference fringe.

For an isotropic plate, the solutions of the potentials in the frequency–wavenumber domain have the forms

where , , is the longitudinal wave number, is the transverse wave number, ω is the angular frequency, and A, B, C, and D are arbitrary constants to be determined by the boundary conditions.

The boundary conditions in the frequency–wavenumber domain can be obtained by applying the Fourier transform[18] to Eq. (6) on x and t, respectively. Substituting the solutions of potentials in Eq. (7) into them, we obtain

where is the transformed distribution function of , is the spectrum of , and is the characteristic matrix of plate system, which can be written as

According to Eq. (4), the out-of-plane displacement can be written as

By applying Fourier transform to Eq. (10), the integral representations of the out-of-plane displacement solutions can be obtained as[19]

Using Cramerʼs rule, the coefficients A, B, C, D in Eq. (10) can be written as , , , and , where denotes the matrix formed by replacing column n of by the vector . Their poles are the roots of the plate secular equation , corresponding to Lamb waves modes.[20] The secular equation can be calculated numerically.

The residue theorem is used to calculate the integral with respect to kx in Eq. (11) to obtain the displacement solution, which can be represented as[21,22]

where can be written as
Equation (12) can be calculated numerically by using the fast Fourier transform (FFT) technique.[19] In order to avoid the poles in real axis, a small imaginary part is added to the frequency ω. In our calculation, the laser pulse rise time τ is 4 ns, which is the same as the parameter of the Nd: YAG pulsed laser system. In order to obtain a better signal, the calculation range of frequency is from 0 to 10 MHz and the calculation range of time is from 0 to 1 ms, which means that the frequency step is 0.01 MHz. The material parameters of a steel plate are given in Table 1.

Table 1.

Parameters of the steel materials.

.
4. Experiment
4.1. Experimental setup and implementation

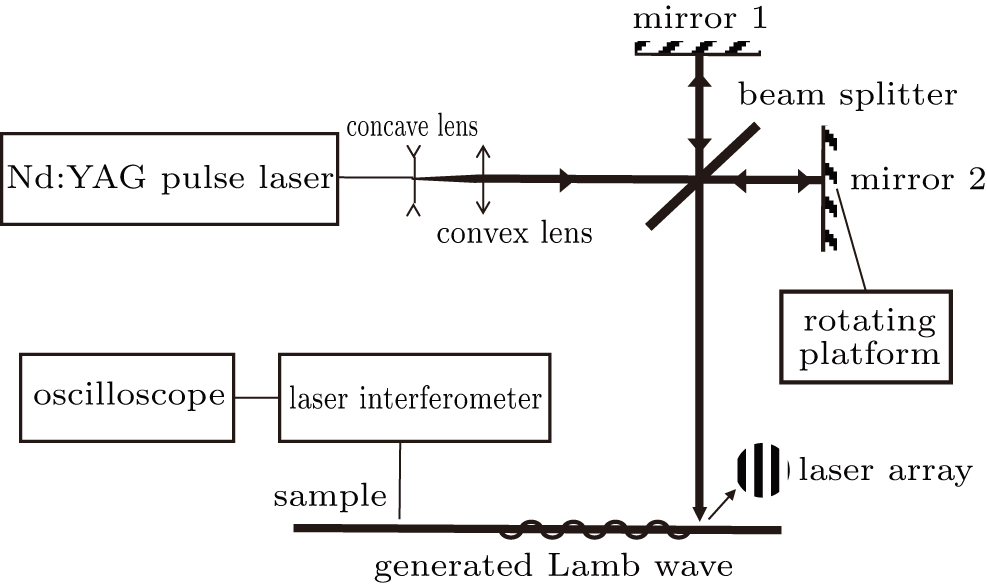
A schematic diagram of the experimental setup is shown in Fig. 4. A Q-switch Nd: YAG pulsed laser with a wavelength of 532 nm was used to generate Lamb wave in a steel plate. In our experimental implementation, the focal lengths of the concave and convex lens were −25 mm and 100 mm respectively, which means that the beam diameter can be expanded 4 times (up to 20 mm). A rotating platform with a minimal adjustable angle 0.0005°, was used to precisely change the angle between two beams. It was controlled by a computer to adjust the fringe spacing through the angle adjustment from several hundreds to several mm. The interference fringes under different conditions could be recorded by thermal paper. The out-of-plane displacement signals generated by this line array were detected by a broadband IOS AIR-1550-TWM laser interferometer with a wavelength of 1550 nm and detecting bandwidth from 25 kHz to 125 MHz.

Fig. 4. Schematic diagram of the experiment setup.
4.2. Comparison between experimental and theoretical results

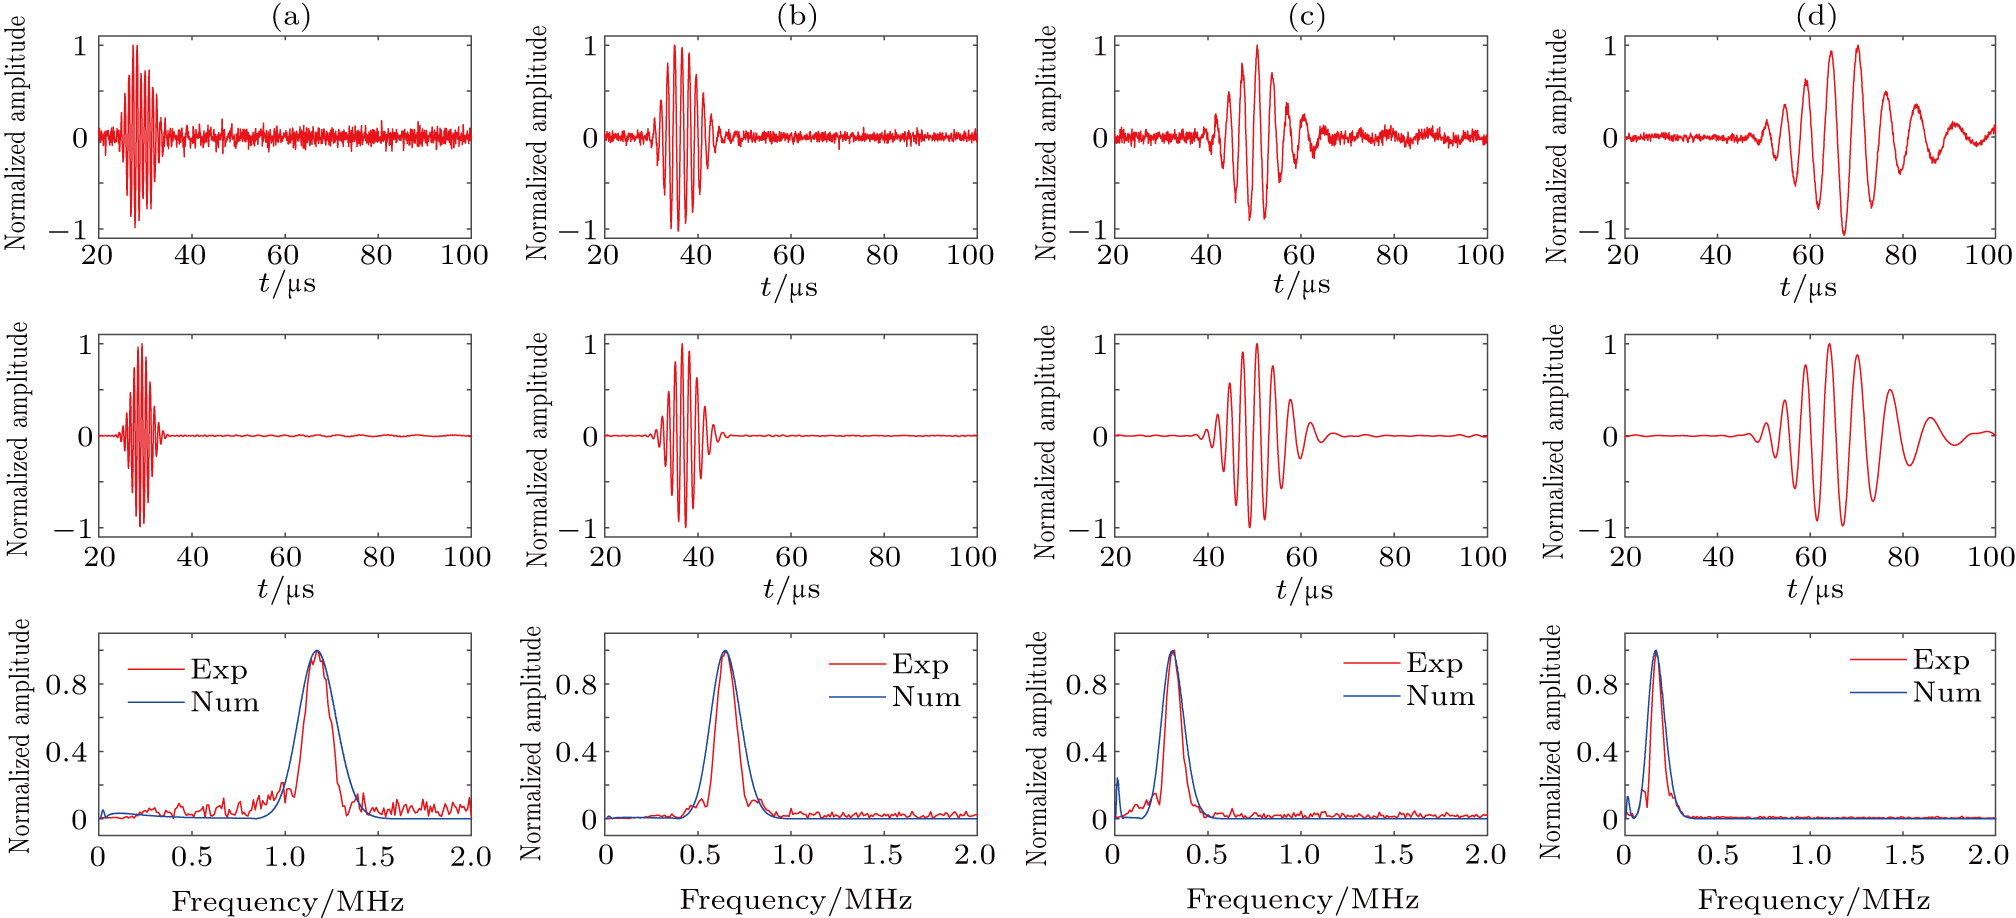
Figure 5 shows a comparison between experimental (top) and theoretical (middle) results for 0.1 mm thick steel sheet under a distance 45 mm from the detecting point to the center of the laser array with different element spacings: 0.88 mm, 1.20 mm, 1.74 mm, and 2.40 mm, respectively. The fringe spacing could be measured from the burn marks on thermal paper. A frequency spectrum comparison between the experimental and theoretical results is given at bottom of Fig. 5.

Fig. 5. (color online) Experimental (top) and theoretical (middle) displacement signals and corresponding frequency spectrums (bottom) for different element spacings: (a) 0.88 mm, (b) 1.20 mm, (c) 1.74 mm, and (d) 2.40 mm.

The narrowband Lamb wave was successfully generated by the laser array produced by the Michelson interference technique. Both velocity and the center frequency of the generated Lamb wave change with array spacing. Larger element spacing corresponds to lower center frequency, and vice versa. The theoretical and experimental results agree well with each other. The displacement signals in Fig. 5 show a characteristic that the smaller fringe spacing has more cycles and the larger spacing has fewer cycles. The reason is that the illuminating area size of laser beam is fixed and the spacing d becomes smaller when the element number of the array increases.

The phase velocity and the group velocity dispersion curves of A0 mode were calculated numerically from the secular equation by using the material parameters in Table 1, and the results are shown in Fig. 6.

Fig. 6. (color online) (a) Phase velocity dispersion curves and (b) group velocity dispersion curve for a 0.1 mm steel plate. The intersecting points between the oblique blue lines and the phase velocity curves correspond to the Lamb wave modes with certain wavelengths. Square and dot represent the center frequency and group velocity of the generated narrowband Lamb wave measured from the experiment signals, respectively.

The intersecting points between the oblique blue lines and the phase velocity curves in Fig. 6(a) are corresponding to the Lamb wave modes with certain wavelengths. The single mode of Lamb wave can be excited according to these wavelengths. The center frequencies measured from experimental signals are shown as squares in Fig. 6(a), which agree well with the frequencies at the intersection points. The group velocities measured from the experimental signals are shown as dots in Fig. 6(b), which show good agreement with the theoretical values. Through appropriately controlling the element spacing, the corresponding guided wave mode with this wavelength will be selectively excited.

Using the adjustable laser line array proposed in this paper, the selective excitation of guided wave mode will be flexible and convenient comparing with traditional laser line array generation techniques, such as lenticular arrays[11,12] and slit masks.[1315] In this paper, only a case of the excitation of an antisymmetric A0 mode at low frequency-thickness product is given, but this method can be used for selectively exciting any other guided wave mode and higher frequency–thickness product case if an appropriate exciting laser source can be used.

5. Conclusion and discussion

In this paper, we present a method of using the Michelson interference technique to implement a new changeable spacing laser exciting array. Using this technique, the selective generation of narrowband zeroth order antisymmetric Lamb wave with a wavelength range from several hundred to several mm has been implemented successfully. The laser line array produced by the Michelson interference technique can be easily adjusted, which enables the flexible generation of narrow band Lamb wave. We propose an intensity distribution function of the laser array profile produced by the Michelson interference technique. Considering this spatial distribution of exciting source and its time function, theoretical analysis for displacement field generation is conducted, and further numerical calculation is carried out to simulate the displacement response excited by this array. Finally, an experimental system is built up to produce the adjustable array to generate narrowband Lamb wave signals, and a laser interferometer is used to detect them. The theoretical results show good agreement with the experimental results.

Owing to the limitation of pulsed laser source, the Lamb wave mode generation for higher frequency–thickness product case has not be conducted. One major reason is that the number of interference fringes will increase with frequency increasing for a fixed size laser beam, and thus the pulse energy of each single fringe of this array will be too weak to generate the guided wave effectively, or the signal-to-noise ratio for the generated signals becomes very bad. The other reason is that the attenuation of higher frequency ultrasonic component will increase. If a higher energy pulsed laser can be used, the excitation of Lamb wave modes for higher frequency–thickness product range may be implemented.

This method proposed in this paper may provide an engineering foundation and possibility of noncontact NDT technique for plate or pipe structures.

Reference
[1] Rose J L 2002 J. Press. Vess. -T ASME 124 273
[2] Lowe M J S Alleyne D N Cawley P 1998 Ultrasonics 36 147
[3] Rose J L Avioli M J Mudge P Sanderson R 2004 NDT & E Int. 37 153
[4] Rose J L Pelts S P Quarry M J 1998 Ultrasonics 36 163
[5] Rose J L 1998 International Society for Optics and Photonics April 16, 1998 Bangalore, India 636
[6] Li J Rose J L 2001 IEEE T. Ultrason. 48 761
[7] Jia X 1997 J. Acoust. Soc. Am. 101 834
[8] Khalili P Cawley P 2016 IEEE T. Ultrason. 63 303
[9] Shi Y Wooh S C Orwat M 2003 Ultrasonics 41 623
[10] Costley R Jr. Berthelot Y H 1993 Rev. Prog. Quant. Nondestr. Eval. 12 579
[11] Cosenza C Kenderian S Djordjevic B B Green R E Pasta A 2007 IEEE Trans. Sonics. Ultrason. 54 147
[12] Kenderian S Djordjevic B B Green R E Jr. 2003 J. Acoust. Soc. Am. 113 261
[13] Choi S Jhang K Y 2013 NDT & E Int. 57 1
[14] Kim H Jhang K Shin M Kim J 2006 NDT & E Int. 39 312
[15] Di Scalea F L Berndt T P Spicer J B Djordjevic B B 1999 IEEE Trans. Sonics Ultrason. 46 1551
[16] Hecht E 2017 Optics 5 Boston Pearson Education 390 420
[17] Rose L R F 1984 J. Acoust. Soc. Am. 75 723
[18] Miklowitz J 1978 The Theory of Elastic Waves and Waveguides New York Elsevier 231 297
[19] Hu W X Qian M L 2000 Chin. J. Acoust. 19 174
[20] Zhang S G Hu W X 2008 Chin. Phys. Lett. 25 4314
[21] Hu W X Qian M L Cantrell J H 2004 Appl. Phys. Lett. 85 4031
[22] Xu Y.F. 2016 A Study of Ultrasonic Testing and Imaging Methods Using Array and Multi-Component Technique Ph.D. Dissertation Shanghai Tongji University in Chinese