Optical Stark deceleration of neutral molecules from supersonic expansion with a rotating laser beam
Yang Yongcheng, Hou Shunyong, Deng Lianzhong
State Key Laboratory of Precision Spectroscopy, East China Normal University, Shanghai 200062, China


† Corresponding author. E-mail: lzdeng@phy.ecnu.edu.cn

Abstract

Cold molecules have great scientific significance in high-resolution spectroscopy, precision measurement of physical constants, cold collision, and cold chemistry. Supersonic expansion is a conventional and versatile method to produce cold molecules with high kinetic energies. We theoretically show here that fast-moving molecules from supersonic expansion can be effectively decelerated to any desired velocity with a rotating laser beam. The orbiting focus spot of the red-detuned laser serves as a two-dimensional potential well for the molecules. We analyze the dynamics of the molecules inside the decelerating potential well and investigate the dependence of their phase acceptance by the potential well on the tilting angle of the laser beam. ND3 molecules are used in the test of the scheme and their trajectories under the impact of the decelerating potential well are numerically simulated using the Monte Carlo method. For instance, with a laser beam of 20 kW in power focused into a pot of in waist radius, ND3 molecules of 250 m/s can be brought to a standstill by the decelerating potential well within a time interval of about 0.73 ms. The total angle covered by the rotating laser beam is about 5.24° with the distance travelled by the potential well being about 9.13 cm. In fact, the molecules can be decelerated to any desired velocity depending on the parameters adopted. This scheme is simple in structure and easy to be realized in experiment. In addition, it is applicable to decelerating both molecules and atoms.

1. Introduction

Scientific interest in cold molecules has been strong for decades due to their important applications in a wide range of research areas, like high-resolution Doppler-free spectroscopy for optical frequency standards[1] or molecular clocks,[2] precision measurement of physical constants,[3] cold collision,[4] and cold chemistry.[5] By using their interaction with external fields, like electrical,[614] magnetic,[1520] or even electromagnetic ones,[2127] cold molecules from supersonic expansion, moving with high kinetic energy but in well-defined direction, can be effectively decelerated. So far, precise velocity control of the decelerated molecules has been experimentally demonstrated with either the electrostatic Stark decelerator or the Zeeman decelerator. However, the same level of velocity control on the molecule has not been realized with the optical Stark decelerator in experiment yet.

The optical Stark decelerator, capable of decelerating both polar and nonpolar molecules, was first demonstrated in experiment by Fulton et al. using a single laser pulse of ∼15 ns in duration[24] and later using pulsed optical lattices of 5.8 ns in duration.[25] Although the kinetic energy of the molecules was reported to have been reduced by up to 50% with intense laser fields on the order of 1011–1012 W/cm2, precision control on the final velocity of the decelerated molecules had not been achieved. Besides, the short duration and lack of mobility of the optical potential prevented it from being fully used in decelerating the molecules, though the well depth was as high as tens of or even hundreds of Kelvin in the above experiments. An alternative way is to work with optical potential wells of moderate laser intensities but with much longer durations. Surely, the optical potential well has to travel along with the decelerating molecules so that the deceleration process can be maintained. Friedrich first proposed scooping molecules from supersonic expansion at right angles by a non-resonant focused laser beam decelerating on a circular path.[21] However, due to lack of centripetal force in the radial direction, fast-moving molecules cannot follow the circular motion of the optical potential well, i.e., the laser focus spot. Recently, we proposed an optical Stark decelerator for molecules with a collinearly travelling potential well and analyzed the behavior of the trapped molecules inside.[28] To ensure the colinearity of the travelling potential well with the molecular beam, two laser reflective mirrors needed to spin simultaneously. It might not be easy to synchronize the motion of two spinning mirrors in a real experiment. Should the moving direction of the potential well be exactly collinear with that of the molecular beam? What would the deceleration effect be if there is a finite angle between the moving direction of the potential well and the molecular beam?

To answer the above questions, in this paper we study in detail the optical deceleration of molecules from supersonic expansion by an orbiting potential well, which is formed by rotating a red-detuned focusing laser beam via a single spinning mirror. The schematic diagram and deceleration principle of the scheme are first introduced, including the equation governing the motion of molecules confined in the potential well. Then, trajectories of ND3 molecules under the impact of the decelerating potential well are numerically simulated using the Monte Carlo method and the corresponding results are presented, which is followed by some discussion. A short conclusion is given in the end.

2. Scheme and deceleration principle
2.1. Schematic diagram

Figure 1(a) shows the schematic diagram of our proposed scheme of decelerating neutral molecules from supersonic expansion with a rotating laser beam. A focusing laser beam propagates from the top down and gets reflected horizontally via a reflective mirror M. When the reflective mirror spins around the vertical axis passing through its center, an orbiting laser focus spot can be obtained in the horizontal plane. The circle orbit of the focus spot has a radius of R. A molecular beam from supersonic expansion crosses the laser focus spot at an approximate right angle. For the red-detuned laser, the orbiting focus spot can serve as a travelling optical potential well for molecules. When the spinning mirror is under brake, the travelling optical potential well will be decelerated, so the molecules will be trapped in it. The final speed of the decelerated molecules depends upon that of the travelling potential well at the moment they leave the orbiting laser spot.

Fig. 1. (color online) (a) Schematic diagram of decelerating neutral molecules from supersonic expansion with a rotating laser beam; (b) principle schematic of slowing molecules via the orbiting laser focus spot under deceleration.
2.2. Longitudinal motion and phase space stability

The red-detuned light field in the laser spot is assumed to have a Gaussian intensity distribution in the radial direction. The dipole potential energy for a molecule at position r (corresponding to the distance from the laser beam axis) can be given as with I0 being the maximum laser intensity at r = 0, α the averaged polarizability of the molecule, ε0 the free space permittivity, and w the waist radius of the laser focus spot. The corresponding dipole force per unit mass in the radial direction is given by with and m the mass of the molecule. Compared to ar, the dipole force per unit mass in the laser propagation direction is negligibly small, as will be shown later. For convenience of description, let us introduce a frame of reference xyz fixed on the laser focus center. This frame is parallel to the lab frame XYZ, as shown in Fig. 1(b). The angle between the laser propagation direction and the lab-fixed axis Z is denoted as θ. The value of θ is taken to be negative for laser beam propagating toward the left side and is positive for laser beam toward the right side. By ignoring , the dipole force per unit mass in the direction of the molecular beam propagation, i.e., the x direction, can be expressed as The maximum value of ax is obtained at and given as .

When the spinning mirror is under brake at an angular deceleration rate γ, the optical potential well will be slowed at a linear deceleration rate of in the tangential direction of the circular orbit, with R being its radius. The projection of the linear deceleration rate of the optical potential well on the x direction is . To describe the motion of the molecule with respect to the potential center, a quantity of the relative velocity is introduced and defined as . The motion for the molecules in the longitudinal direction x is now governed by the following equation: After transformation of Eq. (4) and performing integration on both sides, one can obtain where is the integration constant. Equation (5) describes the trajectory of the molecule in the phase space (x, η) under the impact of the decelerating potential well in the longitudinal direction x.

When the projection of the chosen linear deceleration rate of the optical potential well on the x direction is smaller than the maximal dipole force per unit mass available, i.e., , a phase stable area can be obtained by using Eq. (5) and solving the differential equation . Molecules initially accepted by this area in the phase space will follow the motion of the potential well and be decelerated along with it. Molecules initially outside this area, however, will not be stably decelerated though their velocity might be somewhat perturbed by the potential well.

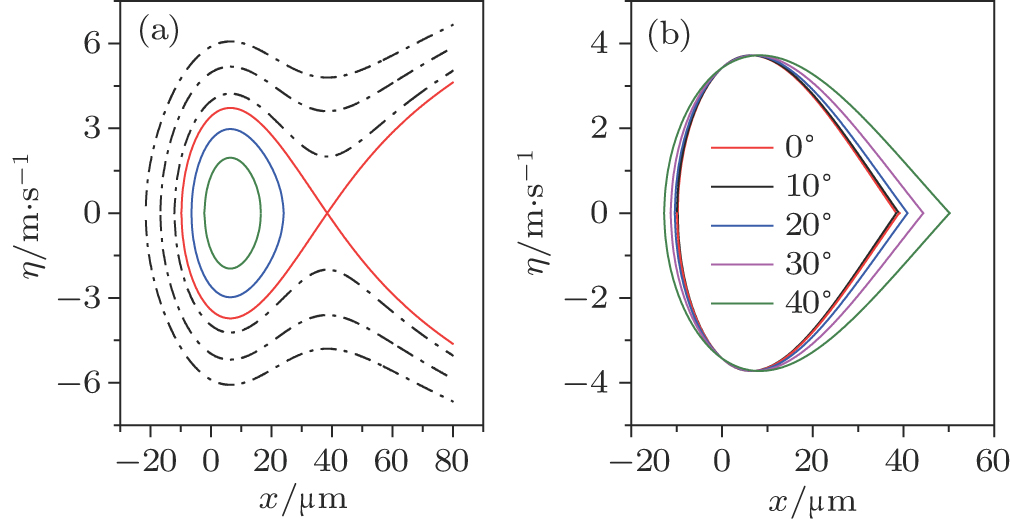
Let us take the ND3 molecule ( ) to test the scheme. Suppose a continuous-wave (CW) laser of 20 kW is focused into a spot of . The resulted peak laser intensity I0 is about . The maximal dipole force per unit mass available is calculated to be about . Figure 2(a) shows the trajectories of a few molecules in phase space with and θ =0°. The dashed curves represent the untrapped molecules, while the solid curves correspond to the trapped ones. The thick red curve indicates the separatrix of the stable area in phase space, i.e., phase acceptance. As discussed above, only molecules initially appearing inside this area can be stably decelerated. Figure 2(b) shows the dependence of the phase stable area on the angle θ. The linear deceleration rate of the potential well is fixed to be . The curves from inside out correspond to cases of θ =0°, 10°, 20°, 30°, and 40°, respectively. With the increase of θ, the phase stable area becomes large more quickly in spatial space, but the maximal acceptable velocity remains almost the same. This can be explained as follows. Since the projection of the focus spot waist on the x direction is given by , it will become large as θ increases, so will the spatial space of the phase acceptance in this direction. The velocity space of the phase acceptance depends on both the maximal dipole force per unit mass and the deceleration rate of the optical potential well . Generally speaking, for fixed value of , the smaller the value of is, the larger the velocity space of the phase acceptance will be; for fixed value of , the larger the value of is, the larger the velocity space of the phase acceptance will be. As discussed above, both and change in a way proportional to , so the velocity space of the phase acceptance remains the same as θ changes. For a real deceleration process, the maximal value of θ might be only a few degrees, as discussed later. Since cos(θ) is a slowly varying function around , the real deceleration process is very much close to the case of θ = 0°, For no loss of generality, however, the analysis is performed here with even large θ values.

Fig. 2. (color online) (a) Trajectories of both trapped and untrapped ND3molecules in phase space with and θ =0°. (b) The phase stable areas of ND3 molecules for cases of θ =0°, 10°, 20°, 30°, and 40°, respectively. The linear deceleration rate of the potential well is fixed to be .
2.3. Transverse motion

The motion of molecules in the y (or Y) direction is governed by the equation figure 3(a) shows the force per unit mass experienced by the ND3 molecule along the y axis in the optical potential well. The maximal value is , the same as that in the x direction. This restoring force can offer a tight transverse confinement for molecules in the y direction during deceleration. For comparison, the force per unit mass for the molecule along the laser beam axis, , is also shown as a function of in Fig. 3(b). Here is the Rayleigh length of the laser focus spot and λ is the laser wavelength ( m). The maximal value of is just about 14.6 m/s2. For an optical deceleration process taking place on the timescale within ∼1 ms, the velocity change of the molecule caused by this force is no more than 1.5 cm/s. So its impact on the deceleration can be safely ignored.

Fig. 3. (color online) The force per unit mass experienced by the ND3 molecule as a function of displacement from the focus center along (a) the y axis and (b) the laser beam axis.

The motion of molecules in the z direction is, however, more complicated. When the orbiting optical potential well is under deceleration of , the motion of molecules in the z direction is governed by the equation When θ = 0°, , and , there is no force acting on the molecules in the z direction. When θ is different from zero, there appears a phase acceptance for molecules, which can be obtained via similar procedures introduced above from the following equation of motion: with being the integration constant and . If θ is close to zero, the spatial space of the phase acceptance is rather broad and its confinement for molecules is too loose to be of real sense. As θ increases in value, the phase acceptance shrinks rapidly in spatial space, so its confinement on molecules gets tight and gradually comes into play. Figure 4 shows the corresponding phase acceptances for θ =±1°, ±5°, and ±10°, respectively. Obviously, when the value of θ increases to 45, the phase acceptances will be the same in the two directions of x and z. The trap center is located on the positive side of the z axis for negative values of θ, as shown in Fig. 4(a); while it is on the negative side of the z axis for positive values of θ, as shown in Fig. 4(b). For a real deceleration process in which the angle of θ changes only a few degrees from negative to positive around zero, the averaged effect of the angle-sensitive phase acceptance on confining the molecules is rather weak, as confirmed in our following simulation.

Fig. 4. (color online) The transverse phase acceptance of ND3 molecules in the z direction for cases of (a) θ = −1°, −5°, −10° and (b) θ = +1°, +5°, +10°.

In fact, due to the coupling of the molecular motion in the three directions of x, y and z, the behavior of the molecule under the impact of the optical potential well is more complicated than in the above analysis. A three-dimensional (3D) numeric simulation of the trajectories of the molecules is necessary and can help us better understand their behavior.

3. Numeric simulation and discussion
3.1. Numeric simulation

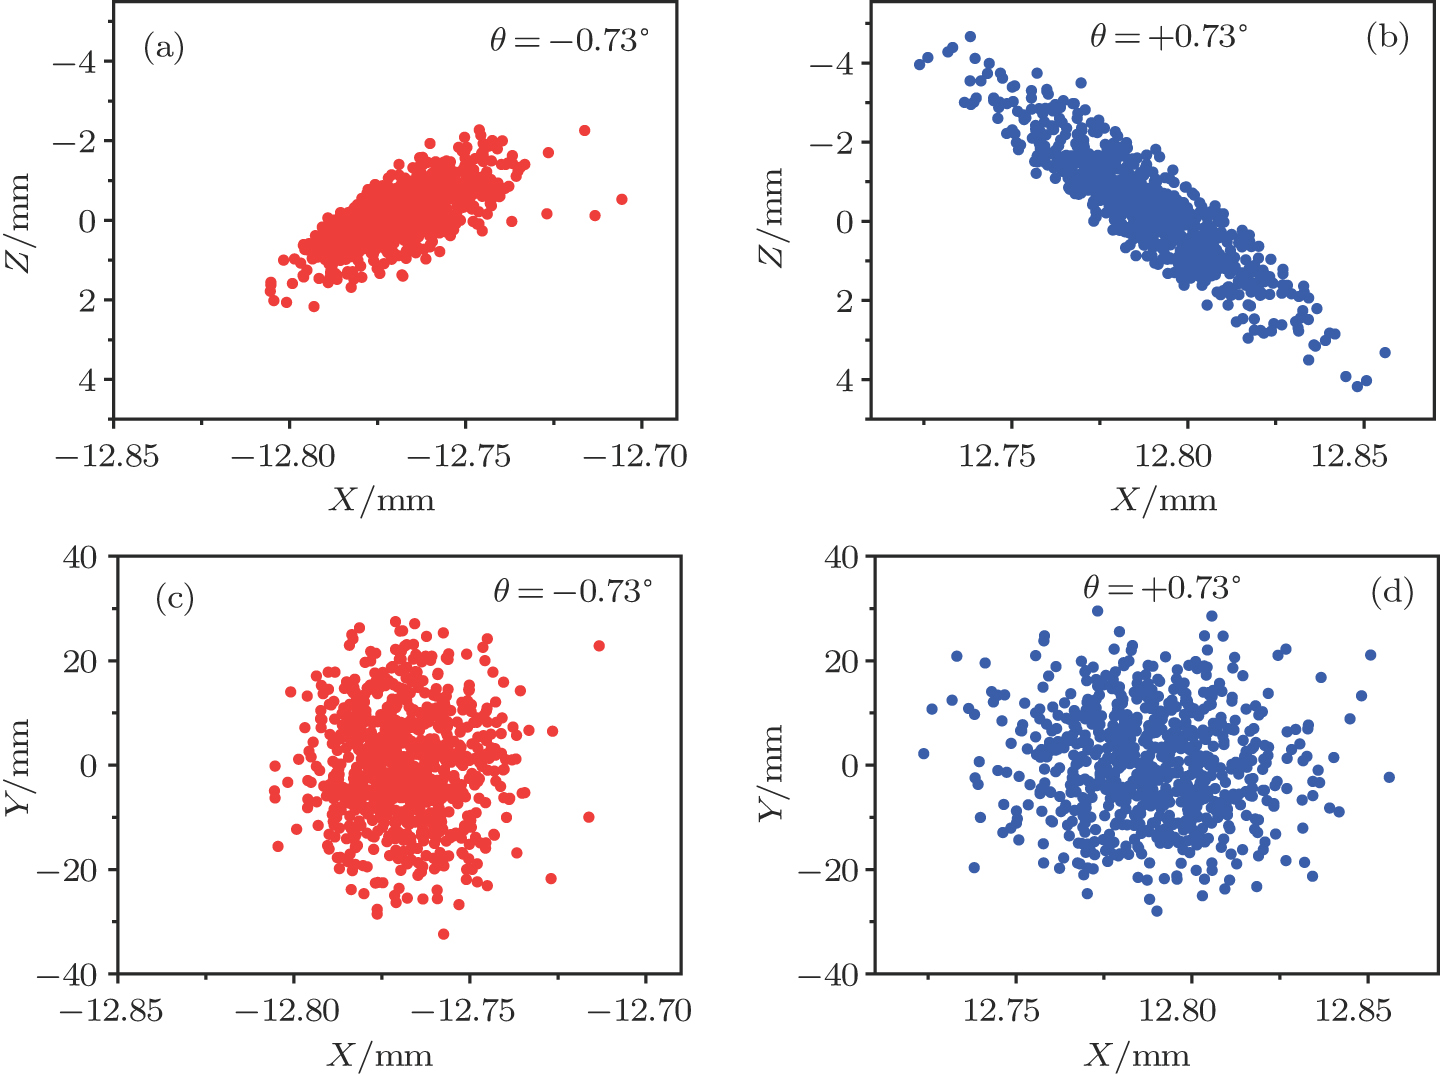
To test the performance of the proposed scheme, the trajectories of ND3 molecules under the impact of the decelerating potential well are simulated using the Monte Carlo method. The pulsed ND3 molecular beam from supersonic expansion is assumed to have a Gaussian velocity distribution centered at with a translational temperature of 2 K in the X direction. The transverse velocity of the molecular beam is centered at zero with a full width at half maximum (FWHM) spread of ∼10 m/s for both Y and Z directions. For a Gaussian laser beam, the effective length of the focus spot can be characterized by twice the Rayleigh length, . With the parameters of in waist radius and in wavelength, the effective length of the laser focus spot is about . The molecular beam intersects the laser focus spot in the middle. For simplicity of simulation, the optical field within the effective length of the focus spot is taken to be uniform along the laser beam axis. The potential well is assumed to overlap with the central section of the molecular beam and have a linear velocity of 250 m/s in the beginning. With the parameters of and R = 1 m, the potential well can be decelerated from 250 m/s to zero within the time interval of about 730 s. The laser beam is rotated from the angle of θ =−2.62° to +2.62° with the total distance covered by the potential well being about 9.13 cm. Molecules outside the effective length of the laser focus spot are considered lost. Figure 5 shows the spatial distribution of the decelerated molecular packet in the planes of XZ and XY for the cases of θ =−0.73° (left panel) and +0.73° (right panel), respectively. Pay special attention to the scale and units of the plot in the directions of , and Z. The angle θ is greatly exaggerated in the plot due to the different scales adopted for the directions of X and Z. As we can see, the orientation of the decelerated molecular packet follows that of the laser focus spot in the spatial space during deceleration. The decelerated molecular packet is well trapped in the radial direction of the laser focus spot due to the optical potential confinement. However, it gradually expands along the laser beam axis due to lack of confinement in this direction, as discussed above. Figure 6 shows the spatial distributions of the decelerated molecular packet in the planes of XY, XZ, and YZ when the optical potential well is brought to a standstill at an angle of θ =+2.62°.

Fig. 5. (color online) The spatial distributions of the decelerated molecular packet in the planes of XZ and XY for cases of (a), (c) θ =−0.73° and (b), (d) θ =+0.73°.
Fig. 6. (color online) The spatial distributions of the decelerated molecular packet in the planes of (a) XY, (b) XZ, and (c) YZ when the optical potential well is brought to a standstill at an angle of θ =+2.62°.

Figure 7 shows the corresponding velocity distribution of the decelerated molecular packet when the potential well is brought to a standstill. The solid symbols indicate the simulation results with the solid line corresponding to a Gaussian fit. The final velocity of the decelerated molecular packet is centered at zero with an FWHM spread of ∼3.65 m/s and ∼4.20 m/s in the directions of X and Y, respectively, as shown in Figs. 7(a) and 7(b). The velocity distribution of the molecular packet in the Z direction is centered at about 3.60 m/s and truncated within the range of about −3 m/s to +11 m/s, since the molecules whose positions are outside the effective length of the laser focus spot (2 mm) are considered lost. The slight shift of the center velocity of the decelerated molecular packet in the Z direction is explained as follows. When the molecule is decelerated along the X direction with the deceleration rate aX in the lab frame, it also experiences a small force per unit mass of in the Z direction due to the tilting angle θ of the laser focus spot. Since aX is negative during deceleration, the value of aZ is negative when and positive when . This means that the molecule is first slightly decelerated and then slightly accelerated by the potential well along the Z direction when the laser beam is rotating from the angle θ =−2.62° to +2.62°. However, the potential well moves more slowly and thus spends more time in covering the latter half angle distance of 0° to 2.62° than in the former one of −2.62° to 0°, so the molecular packet is in total slightly accelerated along the Z direction and thus has its center velocity slightly shifted above zero, as confirmed in our simulation and shown in Fig. 7(c).

Fig. 7. (color online) The velocity distributions of the decelerated molecular packet in the directions of (a) X, (b) Y, and (c) Z when the optical potential well is brought to a standstill at an angle of θ =+2.62°.
3.2. Discussion

With current motor technology, the control of a spinning mirror with an angular deceleration rate γ on the order of is of no challenge, as discussed in detail in our previous work.[28] In fact, the value of γ needs not be constant and can fluctuate during the deceleration process, so long as the value of is less than the maximum deceleration rate available with the optical potential well and thus guarantees a phase-stable region of finite size to be always present for the decelerated molecular packet. The molecule will be decelerated by the potential well so long as it remains inside the effective length of the focus spot. For instance, with the parameters of and , the Rayleigh length of the focus spot, , is about 4.72 mm. Supposing that the molecule starts in the middle of the focus spot and the deceleration process takes place within the timescale of about 1 ms, the initial velocity of the molecule in the Z direction should be no more than ∼4.72 m/s in order to be decelerated from 250 m/s to zero in the longitudinal direction of X. This acceptable velocity of ∼4.72 m/s is already larger than those in the directions of X and Y. When the laser focus spot orbits along the circle of radius R from −θ to +θ, its center changes position in the Z direction and the displacement is given by . The molecule must stay in the laser focus spot to be decelerated. Therefore, the largest angle that the laser focus can deviate from the Z axis is limited by its Rayleigh length . For the case of , the value of is about 5.56°. A higher laser power can result in increased volume of the focus spot and decreased time of the deceleration, i.e., increased phase acceptance for molecules, and is thus extremely beneficial to improving the number of decelerated molecules. With the advancement of laser technology, single-mode CW lasers of power up to ∼20 kW and multi-mode CW lasers of power up to ∼500 kW are now commercially available.[29] If a molecular beam of even higher longitudinal velocity is used, the initial angular speed of the spinning mirror will be increased accordingly, and the final velocity of the decelerated molecular packet will become larger under fixed laser intensity and deceleration rate.

The total number N of molecules accepted by the potential trap can be estimated as N = fnV. Here, n is the number density of molecules. V is the effective volume of the trap, out of which the laser intensity decreases to below half the maximum value, estimated as with w the laser beam waist and λ the laser wavelength. f is the fraction of molecules whose velocities fall in the range of with v0 being the trap velocity and being the maximum velocity accepted by the trap. For a laser focus spot with a waist radius of about , the effective volume of the trap V is on the order of 10−5 cm3 ( ). Assume the supersonic ND3 molecular beam has a translational temperature of ∼2 K with number densities of 1013–1014 molecules/cm3. With the linear deceleration rate of the potential well being , the maximum acceptable velocity is about , and the total number of molecules first captured by the optical trap is on the order of 105–106. Due to expansion in the direction of the laser beam axis, the final volume occupied by the decelerated molecular packet increases by a factor of about 2–3, and the final density of the decelerated molecules can be estimated to be about 109–1010 molecules/cm3.

Once the polar molecules are decelerated to low-enough velocities, they can be either trapped locally by an electrostatic trap[30,31] or confined in an electrostatic storage ring.[32] In particular, an opto-electrostatic storage ring for cold dipolar molecules can be conveniently formed by incorporating the scheme into an electrostatic quadrupole or hexapole torus. Figure 8 presents a possible schematic plot of the idea. The laser field is used for decelerating the molecules in the longitudinal direction while the electrostatic quadrupole field confines them from escaping in the laser propagation direction. Storage rings are conventionally loaded with molecules exiting from an electrostatic Stark decelerator.[3234] Though as an effective machine in decelerating polar molecules, the electrostatic Stark decelerator has proven to be rather demanding in experimental operation. However, the opto-electrostatic storage ring mentioned above is rather simple in both structure and operation.

Fig. 8. (color online) Schematic plot of a possible opto-electrostatic storage ring for cold dipolar molecules.
4. Conclusion

In conclusion, we have theoretically studied the dynamics of decelerating a molecular beam from supersonic expansion with an orbiting optical potential well formed by rotating a red-detuned focusing laser beam via a spinning mirror. The dependence of the phase acceptance of the optical potential well for molecules on the tilting angle θ of the laser beam is thoroughly investigated. The trajectories of ND3 molecules under the impact of the decelerating potential well are numerically simulated using the Monte Carlo method. For instance, with the parameters of the laser power P = 20 kW, the waist radius of the laser focus spot , the radius of the circle orbit R = 1.0 m, and the angular deceleration of the spinning mirror , ND3 molecules of 250 m/s can be brought to a standstill by the decelerating potential well within a distance of about 9.13 cm and a time interval of about 0.73 ms. The total angle covered by the rotating laser beam is just about 5.24°. The distributions of the decelerated molecular packet in both spatial and velocity spaces from the simulation are analyzed and the corresponding results are presented. In fact, the molecules can be decelerated to any desired velocity depending on the deceleration parameters adopted. Compared to other methods for slowing neutral molecules, such as the electrostatic Stark decelerator or the Zeeman decelerator, the optical Stark decelerator proposed here is rather simple in structure and easy to operate. It can be used to decelerate either polar or nonpolar molecules as well as atoms and should find wide applications in a wide range of experiments working with cold molecules or atoms.

Reference
[1] Bodermann B Klug M Knöckel H Tiemann E Trebst T Telle H R 1998 Appl. Phys. 67 95
[2] Foreman S M Marian A Ye J Petrukhin E A Gubin M A Mücke O D Wong F N C Ippen E P Kärtner F X 2005 Opt. Lett. 30 570
[3] Veldhoven J Küpper J Bethlem H L Sartakov B van Roij A J A Meijer G 2004 Eur. Phys. J. 31 337
[4] Burnett K Julienne P S Lett P D Tiesinga E Williams C J 2002 Nature 416 225
[5] Willitsch S Bell M T Gingell A D Procter S R Softley T P 2008 Phys. Rev. Lett. 100 043203
[6] Bethlem H L Berden G Meijer G 1999 Phys. Rev. Lett. 83 1558
[7] Bethlem H L Crompvoets F M H Jongma R T Meerakker S Y T Meijer G 2002 Phys. Rev. 65 053416
[8] Bochinski J R Hudson E R Lewandowski H J Meijer G Ye J 2003 Phys. Rev. Lett. 91 243001
[9] Tarbutt M R Bethlem H L Hudson J J Ryabov V L Ryzhov V A Sauer B E Meijer G Hinds E A 2004 Phys. Rev. Lett. 92 173002
[10] Hudson E R Ticknor C Sawyer B C Taatjes C A Lewandowski H J Bochinski J R Bohn J L Ye J 2006 Phys. Rev. 73 063404
[11] Jung S Tiemann E Lisdat C 2006 Phys. Rev. 74 040701
[12] Meek S A Bethlem H L Conrad H Meijer G 2008 Phys. Rev. Lett. 100 153003
[13] Quintero-Pérez M Jansen P Wall T E Berg J E Hoekstra S Bethlem H L 2013 Phys. Rev. Lett. 110 133003
[14] Hou S Y Li S Q Deng L Z Yin J P 2013 J. Phys. B: At. Mol. Opt. Phys. 46 045301
[15] Vanhaecke N Meier U Andrist M Meier B H Merkt F 2007 Phys. Rev. 75 031402
[16] Hogan S D Wiederkehr A W Schmutz H Merkt F 2008 Phys. Rev. Lett. 101 143001
[17] Narevicius E Libson A Parthey C G Chavez I Narevicius J Evem U Raizen M G 2008 Phys. Rev. Lett. 100 093003
[18] Narevicius E Libson A Parthey C G Chavez I Narevicius J Even U Raizen M G 2008 Phys. Rev. 77 051401
[19] Wiederkehr A W Schmutz H Merkt F 2012 Mol. Phys. 110 1807
[20] Motsch M Jansen P Agner J A Schmutz H Merkt F 2014 Phys. Rev. 89 043420
[21] Friedrich B 2000 Phys. Rev. 61 025403
[22] Barker P F Shneider M N 2001 Phys. Rev. 64 033408
[23] Dong G J Lu W Barker P F 2004 Phys. Rev. 69 013409
[24] Fulton R Bishop A I Barker P F 2004 Phys. Rev. Lett. 93 243004
[25] Fulton R Bishop A I Shneider M N Barker P F 2006 Nat. Phys. 2 465
[26] Yin Y L Zhou Q Deng L Z Xia Y Yin J P 2009 Opt. Express 17 10706
[27] Xia Y Yin Y L Ji X Yin J P 2012 Chin. Phys. Lett. 29 053701
[28] Deng L Z Hou S Y Yin J P 2017 Phys. Rev. 95 033409
[29] http://www.ipgphotonics.com/group/view/8/Lasers%
[30] Bethlem H L Berden G Crompvoets F M H Jongma R T Roij A J A Meijer G 2000 Nature 406 491
[31] Li S Q 2016 Chin. Phys. 25 113702
[32] Crompvoets F M H Bethlem H L Jongma R T Meijer G 2001 Nature 411 174
[33] Heiner C E Bethlem H L Meijer G 2009 Chem. Phys. Lett. 2 069
[34] Zieger P C Eyles C J Meerakker S Y T Roij A J A Bethlem H L Meijer G 2013 Z. Phys. Chem. 227 1605