Modulation of multiphoton resonant high-order harmonic spectra driven by two frequency-comb fields
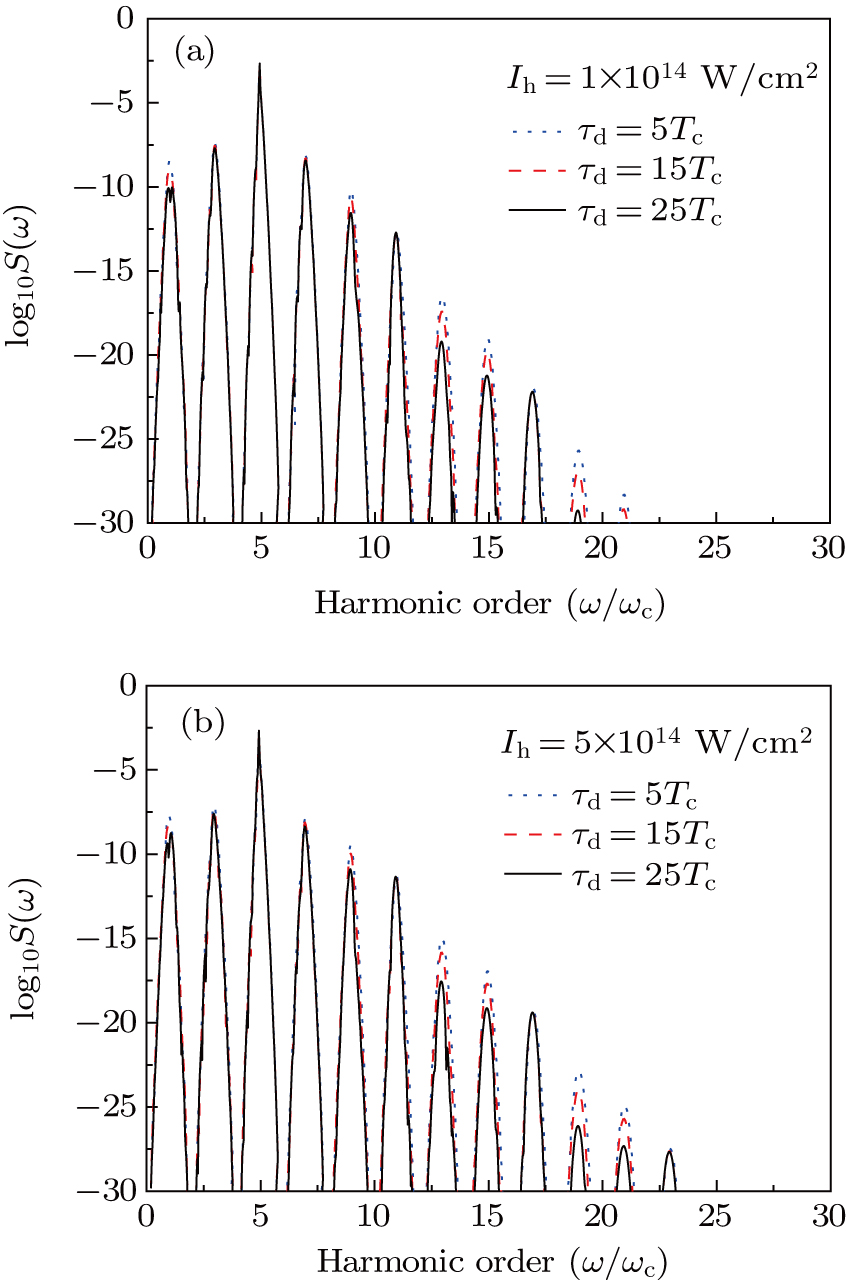
(color online) HHG power spectra with (a) 


Modulation of multiphoton resonant high-order harmonic spectra driven by two frequency-comb fields |
|
(color online) HHG power spectra with (a) |
 |