Stochastic resonance in an under-damped bistable system driven by harmonic mixing signal
Jin Yan-Fei
Department of Mechanics, Beijing Institute of Technology, Beijing 100081, China


† Corresponding author. E-mail: jinyf@bit.edu.cn

Abstract

Stochastic resonance (SR) is studied in an under-damped bistable system driven by the harmonic mixing signal and Gaussian white noise. Using the linear response theory (LRT), the expressions of the spectral amplification at fundamental and higher-order harmonic are obtained. The effects of damping coefficient, noise intensity, signal amplitude, and frequency on spectral amplifications are explored. Meanwhile, the power spectral density (PSD) and signal-to-noise ratio (SNR) are calculated to quantify SR and verify the theoretical results. The SNRs at the first and second harmonics exhibit a minimum first and a maximum later with increasing noise intensity. That is, both of the noise-induced suppression and resonance can be observed by choosing proper system parameters. Especially, when the ratio of the second harmonic amplitude to the fundamental one takes a large value, the SNR at the fundamental harmonic is a monotonic function of noise intensity and the SR phenomenon disappears.

1. Introduction

Stochastic resonance (SR) can be considered as a synchronization of noise-induced hopping between the potential wells with a weak periodic forcing.[17] For a given nonlinear system, the time-scale matching condition for SR depends on the noise intensity and the period of the driving force. Therefore, noise, nonlinear potential, and periodic driving force have an important effect on the occurrence of SR. For example, Ai and Liu[7] found that an optimal stochastic potential may induce a doubly stochastic resonance (DSR). When the intensity of the stochastic potential is too large, the effect of the double well diminishes and the SR phenomenon disappears. However, most of studies on SR only involve the stochastic systems subjected to one periodic force. Recently, it is found that the harmonic mixing signal plays a constructive role in the context of vibrational resonance or controlling SR.[820] Landa and McClintock[8] found the vibrational resonance in an over-damped bistable system subjected to two periodic fields. Gitterman[9] showed that an additional periodic field has control over the shift of the resonance frequency, which is desirable in electronic devices or lasers. Chizhevsky[11,12] reported the experimental evidence of suppression of vibrational higher-order harmonics in a bistable vertical-cavity surface-emitting laser driven by two harmonic signals with very different frequencies. Yang et al.[14] investigated the response to the low-frequency of a bistable system perturbed by a low-frequency and a high-frequency excitation. Gammaitoni et al.[15,16] proposed the concept of controlling SR by using the periodic mixing signal and developed a general theoretical framework based on a rate equation approach. Schmid et al.[17] used the harmonic mixing signal to enhance or suppress the nonlinear SR in an over-damped bistable system. Grigorenko et al.[18] investigated the response of a bistable system with a frequency mixing force and reported the SR through the experiment of an iron garnet thin film. Jin et al.[19] studied the phenomenon of SR in an asymmetric bistable system subjected to the multiplicative and additive white noises and two periodic fields. Machura et al.[20] explored transport properties of the Brownian particles in a symmetric potential driven by the time-periodic biharmonic signals. They demonstrated that the symmetric driving cannot distinguish the direction in the frictionless case. In the case of over-damped motion, the antisymmetric driving leads to zero current. Hence, the study of the SR in nonlinear systems driven by two periodic fields and noise is of great signification.

Generally, most of the dynamical systems using in the study of SR are restricted to over-damped regimes, then the inertial term can be neglected and the theoretical analysis is simplified. However, for intermediate and small damping, the inertial effects should be considered and the under-damped dynamical systems are modeled. The SR phenomenon in the under-damped nonlinear systems and the effects of damping on dynamical behaviors have attracted attention from the scientists of different research fields.[2131] Du et al.[21] and Wu et al.[22] found the damping induced stochastic multi-resonance in an under-damped bistable system with delay and without delay, respectively. Saikia[23] showed that the average input energy displays a peaking behavior with the damping coefficient. That is, damping plays a crucial role in the nature of SR in the multistable system. Lindner et al.[25] investigated the non-equilibrium dynamics of massive damped Brownian particles in an asymmetric periodic potential driven by colored noise. They demonstrated that the finite inertia can enhance the noise-induced transport in a ratchet potential and that for this transport there exhibits an optimal temperature of the embedding bath. Kang et al.[26,27] explored the SR phenomenon in an under-damped Duffing oscillator by using the moment method under the weak noise limit. Jin et al.[29,30] studied the noise-induced resonances in an under-damped periodic potential driven by colored noise and correlated noise, respectively. Xu et al.[31] implemented a numerical investigation of SR in the under-damped bistable system subjected to a weak asymmetric dichotomous noise and a periodic signal. Therefore, an under-damped bistable system is adopted to demonstrate the effects of the harmonic mixing signal on SR in this paper.

The objective of this investigation is to analyze SR phenomenon at fundamental and higher-order harmonic in an under-damped bistable system driven by harmonic mixing signal and Gaussian white noise. Using the LRT, the analytic expressions of the spectral amplification are derived at the fundamental and higher-order harmonic. The effects of the system parameters on the spectral amplification are discussed in Section 2. In Section 3, the system responses, PSD and SNR are calculated to demonstrate the SR and verify the theoretical results. Finally, some conclusions are drawn in Section 4.

2. Spectral amplification

The model of concern is an under-damped particle moving in a bistable potential system, which is driven by Gaussian white noise and a harmonic mixing signal

where γ is the damping coefficient, denotes a symmetric bistable potential function with a potential barrier , D denotes the noise intensity, the noise term is Gaussian white noise with zero mean and autocorrelation function as follows:

The harmonic mixing signal G(t) is given by

where A is the fundamental amplitude, ε is the ratio of the second harmonic amplitude to A, and Ω is the frequency of signal.

Let , equation (1) can be rewritten as follows:

In the absence of any excitation (i.e., , equation (4) has one unstable equilibrium state and two stable equilibrium states for .

The corresponding Fokker–Planck equation of Eq. (4) is found to be

where .

According to Eq. (5), the quasi-stationary probability density is obtained as follows:

where the modified potential function and N is the normalization constant.

From Eq. (6), the transition rates out of can be obtained under the adiabatic limit condition[1]

where W0 stands for Kramers rate of Eq. (1) driven only by noise, and the expression can be given by[26]

Using the two-state theory of SR, is defined as the occupation probabilities of the stable states . Then, the master equation for the occupation probabilities is found to be

Based on the definition of time-dependent mean value and Eq. (9), the differential equation for can be derived as

For the weak signal limit, the expansion of Eq. (7) reads

Substituting Eq. (11) into Eq. (10) leads to the analytical solution in the stationary limit
where the amplitudes Mn bring in an additional phase lag for each Fourier component.

Then, the spectral amplification (i = 1,2,3) at the i-th harmonic are obtained within the LRT[16]

where

To understand the above theoretical results (13)–(15), one can turn to a case study, where the system parameters are chosen as a = b = 1 and A = 0.01. Figures 13 show the behaviors

Fig. 1. (color online) Spectral amplification ηi (i = 1,2,3) versus noise intensity D for ε = 1, Ω = 0.1, and different γ.
Fig. 2. (color online) Spectral amplification (i = 1,2,3) versus noise intensity D for γ = 0.1, Ω = 0.1, and different ε.
Fig. 3. (color online) Spectral amplification (i = 1,2,3) versus noise intensity D for γ = 0.1, ε = 1, and different Ω.

of the spectral amplification (i = 1,2,3) as a function of D for different γ, ε, and Ω. The curves of (i = 1, 2 display a bell shape with the increase in D and SR exists. In Fig. 1, the value of ( ) increases and the position of the peak shifts to the left side with decreasing γ. Especially, the curve of shows two maximums and one minimum with increasing D in Fig. 1(c). That is, both of noise-induced suppression and resonance are found in the spectral amplification at the third harmonic. While the noise-induced suppression disappears as the damping γ is increased.

In Fig. 2, the value of decreases with the increase in ε, while the value of increases with the increase of ε (see Figs. 2(a) and 2(b)). This phenomenon happens because the parameter ε denotes the ratio of the second harmonic amplitude to the fundamental one. Thus, with the increase of ε, the second term in the harmonic mixing signal has a great effect on SR. From Fig. 2(c), the value of the peak increases with increasing ε in the case of and the noise-induced suppression disappears for ε = 0.5. In other words, when the ratio of the second harmonic amplitude to the fundamental one is small, the interaction between the two parts of the harmonic mixing signal is weak. The first part of harmonic mixing signal plays a major role in the occurrence of SR for .

In Fig. 3, the values of (i = 1,2) increase and the positions of the peak shift to the left side with decreasing Ω. It is observed that the optimal noise intensity for SR increases with increasing Ω. The bimodal structure is observed in the curve of for small Ω. When Ω = 0.1, the noise-induced suppression disappears in Fig. 3(c). For the generation of the third harmonic, the effect of resonance and suppression is really small compared with that at first and second harmonics.

3. Numerical results

To better understand the influences of harmonic mixing signal on SR and verify the above theoretical results, the numerical results of Eq. (1) are presented by using the fourth-order Runge–Kutta algorithm in this section. In the following analysis, the PSD and SNR are calculated to measure the SR phenomena. It is convenient to quantify SR phenomenon by the intensity of a peak in the PSD and the resonance peak in the SNR.

3.1. Power spectral density

Figure 4 shows the time history and the phase trajectory at four different levels of noise intensity. In Fig. 4(a), the particle stays in the right potential well for weak noise intensity D = 0.02. With the increase in noise intensity (i.e., D = 0.12 in Fig. 4(c)), the particle switches almost periodically between the right and the left potential well. Namely, the synchronization between noise-induced hopping and the weak signal takes place for a suitable dose of noise intensity. If the noise intensity continues to increase (i.e., D = 0.3 in Fig. 4(d)), the noise-induced hopping events between the potential wells will happen more frequently, where the statistical synchronization vanishes and the SR effect is weakened.

Fig. 4. (color online) Time history and phase trajectory of the system (1) for a = b = 1, γ = 0.9, A = 0.01, Ω = 0.1, ε = 1. (a) D = 0.02; (b) D = 0.08; (c) D = 0.12; (c) D = 0.3.

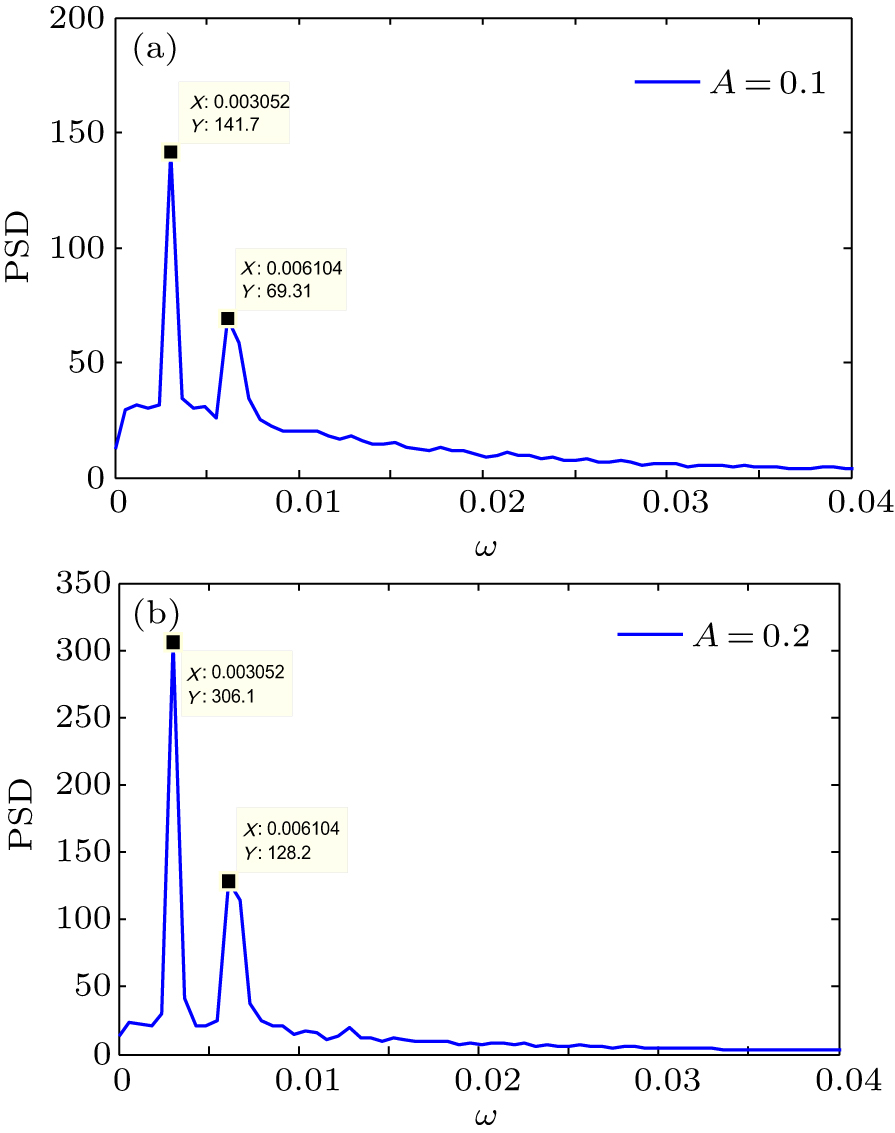
The PSD of the mean value is plotted to characterize the SR at first and second harmonic in Figs. 5 and 6. From Figs. 5 and 6, there are two peaks appearing at and , respectively. That is, the SR phenomenon happens at first and second harmonic, which is observed also from the theoretical results (see Figs. 13). The intensity of the peak in PSD decreases with increasing γ as shown in Fig. 5. Compared with Fig. 5(a), the positions of peaks in Fig. 6(a) are changed by choosing different Ω. It is seen from Fig. 6 that the intensity of the peak in PSD increases with the increase in A.

Fig. 5. The PSD of for a = b = 1, A = 0.1, Ω = 0.1, D = 0.15, ε = 1. (a) γ = 0.9; (b) γ = 1.2.
Fig. 6. The PSD of for a = b = 1, γ = 0.9, Ω = 0.02, D = 0.15, ε = 1. (a) A = 0.1; (b) A = 0.2.
3.2. Signal-to-noise ratio

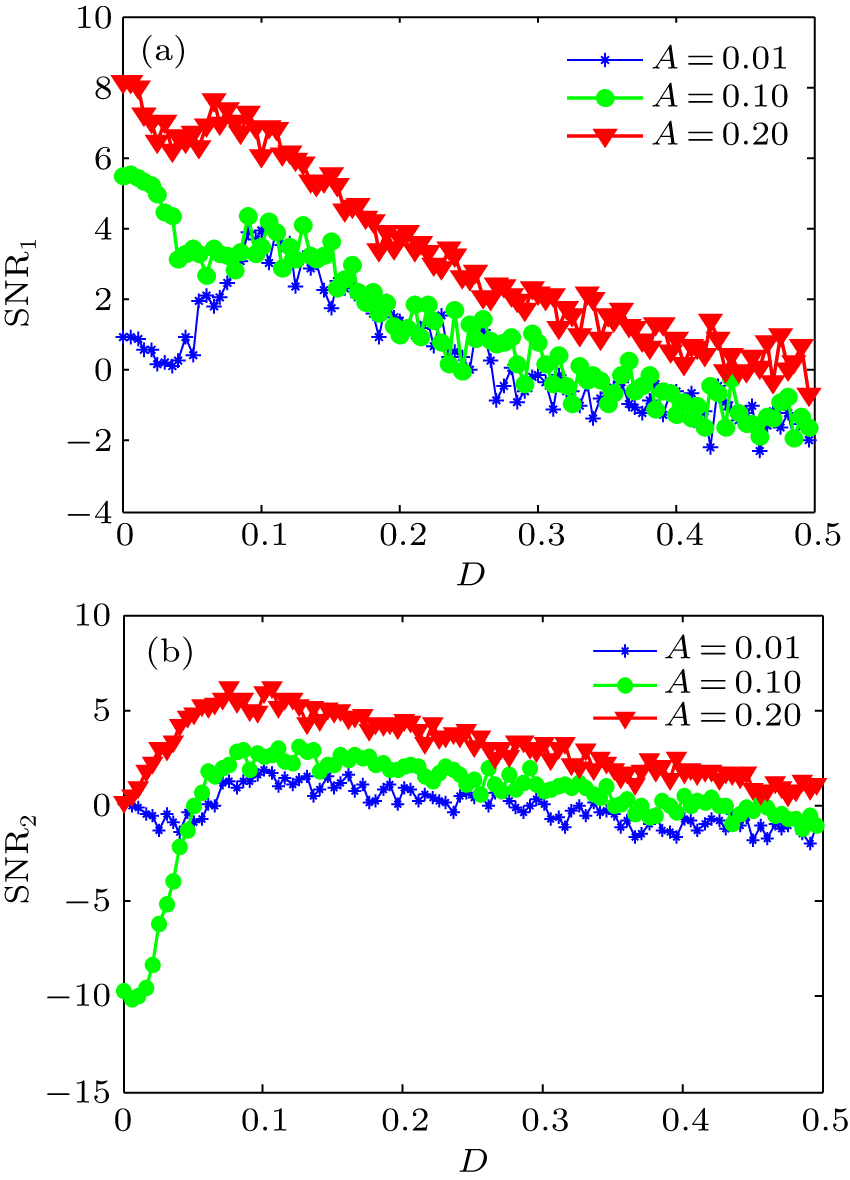
In the following analysis, the signal-to-noise ratio (SNR) is introduced as a characteristic measure of SR. The SNR is calculated by dB, where S and N are the amplitudes of the signal and noise background respectively. The S is determined directly from the power spectrum at the driving frequency of the external periodic signal, and N is the average of these amplitudes corresponding to 10 frequency values around the driving frequency in the power spectrum. Here, the SNR at the Ω and 2Ω are defined as SNR1 and SNR2, respectively. The influences of noise intensity D, signal amplitude A, driving frequency Ω, and the ratio of the second harmonic amplitude to the fundamental one ε on the SNR1 and SNR2 are discussed in Figs. 79. It is seen that the curves of SNR1 vs. D exhibit a minimum first and a maximum later as shown in Fig. 7(a). That is, both of the noise-induced suppression and resonance are found in the curves of SNR1. From Fig. 7(b), the noise-induced suppression disappears and only the noise-induced resonance appears in the curves of SNR2 vs. D for the case of A = 0.2. It is found that the values of SNR1 and SNR2 increase with the increase of A, which coincide with the results shown in Fig. 6.

Fig. 7. (color online) The SNR1 and SNR2 of the system (1) as a function of noise intensity for a = b = 1, γ = 0.9, ε = 1, Ω = 0.1 with different A.
Fig. 8. (color online) The SNR1 and SNR2 of system (1) as a function of noise intensity for a = b = 1, γ = 0.9, ε = 1, A = 0.01 with different Ω.
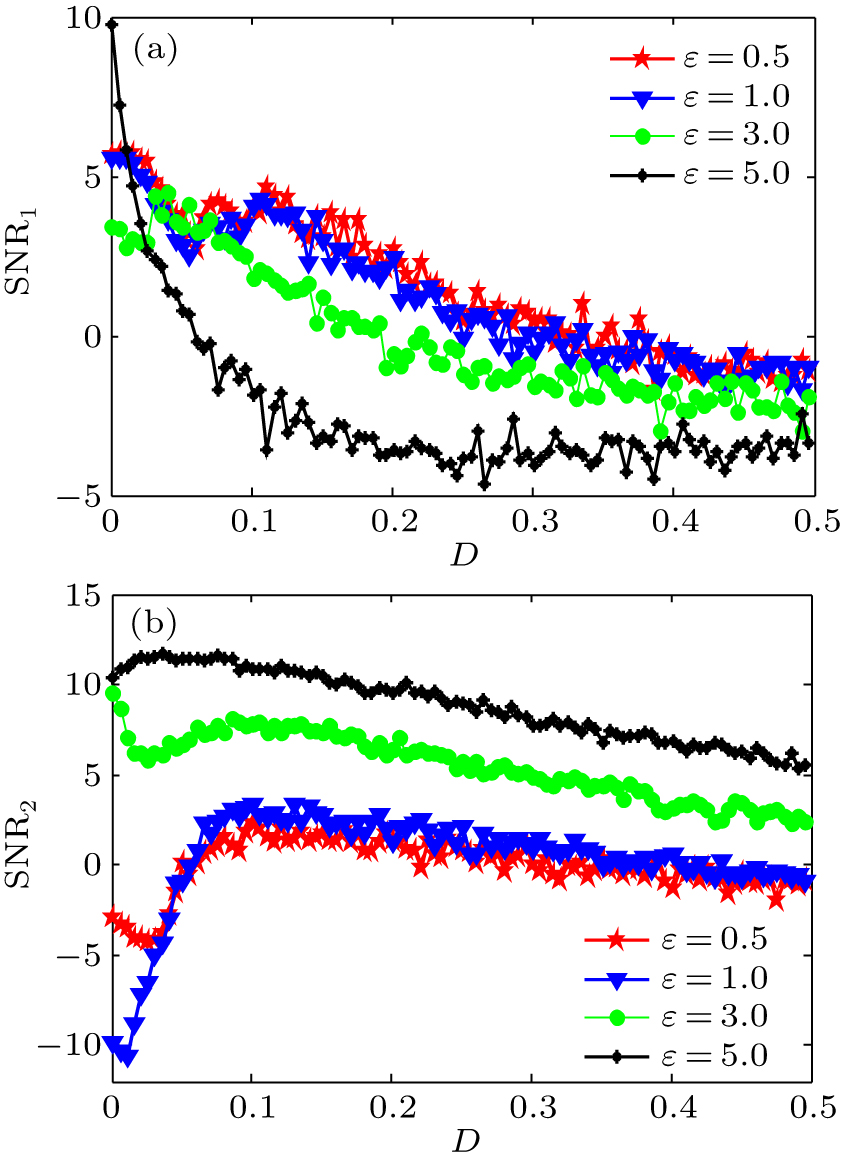
Fig. 9. (color online) The SNR1 and SNR2 of the system (1) as a function of noise intensity for a = b = 1, γ = 0.9, Ω = 0.1, A = 0.1 with different ε.

The effects of Ω on the SNR are shown in Fig. 8. It is found that the curves of SNR1 and SNR2 display a minimum first and a maximum later with increasing D. When the values of Ω increase, the peak values of SNR1 and SNR2 decrease. Meanwhile, the positions of peak in SNR1 and SNR2 moves to right side with the increase of Ω. It is clear that the theoretical results in Fig. 3 agreet with the numerical results as shown in Fig. 8.

In Fig. 9, the SNR is a function of D for A = 0.1 with different ε. When ε = 0.5 and ε = 1.0, both of the SNR1 and SNR2 manifest the noise-induced suppression and SR at certain values of noise intensity. At the same time, the values of SNR1 are bigger than those of SNR2 for ε = 0.5 and ε = 1.0. For ε = 3.0, the curves of the SNR1 and SNR2 exhibit the suppression and resonance simultaneously. However, the values of SNR2 are bigger than those of SNR1 for this case. This phenomenon can be explained as the amplitude of is bigger than that of . When ε continues to increase (i.e., ε = 5.0), both of the noise-induced suppression and resonance in SNR1 disappear (see Fig. 9(a)). On the other hand, the SNR2 increases and shows a single-peak structure in Fig. 9(b), which indicates that the second term in the harmonic mixing signal has a dominant effect on SR in this case. That is, SR phenomenon can only be found at 2Ωwhen ε takes a big value. From Fig. 9, the value of SNR1 decreases and the value of SNR2 increases with the increase in ε, which is consistent with the theoretical results shown in Fig. 2.

4. Conclusion

The phenomenon of SR is analyzed in an under-damped bistable system driven by harmonic mixing signal and Gaussian white noise. The expressions of spectral amplification at fundamental and higher-order harmonic are obtained by using the LRT. It is observed that the curves of the spectral amplification at first and second harmonic show the pronounced single-peak as noise intensity increases. The spectral amplification at third harmonic has a bimodal structure with the increase of noise intensity. That is, the noise-induced suppression and resonance can be found at the third harmonic. This bimodal structure can change to a unimodal one by increasing damping and signal frequency or decreasing the ratio of the second harmonic amplitude to the fundamental one. Moreover, the values of the spectral amplification at third harmonic are very smaller compared with those at first and second harmonic. The PSD and SNRs at the fundamental and second harmonic are calculated numerically to quantify the SR phenomenon and verify the theoretical results. It is shown that the curves of SNR exhibit a minimum first and a maximum later as the noise intensity increases. That is, both of the noise-induced suppression and resonance are found in this system. The values of SNR increase with increasing amplitude and decreasing signal frequency. The SNR at the fundamental harmonic is a monotonic function of noise intensity by choosing a certain value of the ratio of the second harmonic amplitude to the fundamental one.

Reference
[1] Gammaitoni L Hänggi P Jung P Marchesoni F 1998 Rev. Mod. Phys. 70 223
[2] McNamara B Wiesenfeld K 1989 Phys Rev 39 4854
[3] Hu G Nicolis G Nicolis C 1990 Phys. Rev. 42 2030
[4] Xu Y Wu J Du L Yang H 2016 Chaos Solit. Fract. 92 91
[5] Jin Y F Ma Z M Xiao S M 2017 Chaos Solit. Fract. 103 470
[6] Xu P F Jin Y F Xiao S M 2017 Chaos 27 113109
[7] Ai B Q Liu L G 2007 J. Stat. Mech. 2007 P02019
[8] Landa P S Mcclintock P V E 2000 J. Phys. 33 L433
[9] Gitterman M 2001 J. Phys. 34 L355
[10] Jung P Talkner P 1995 Phys. Rev. 51 2640
[11] Chizhevsky V N 2015 Phys. Rev. 92 032902
[12] Chizhevsky V N 2014 Phys. Rev. 90 042924
[13] Yang J H Liu X B 2010 Chaos 20 033124
[14] Yang J H Sanjuán M A F Liu H G 2016 Commun Nonlinear Sci. Numer. Simulat. 30 362
[15] Gammaitoni L Löcher M Bulsara A Hänggi P Neff J Wisesnfeld K Ditto W Inchiosa M E 1999 Phys. Rev. Lett. 82 4574
[16] Löcher M Inchiosa M E Neff J Bulsara A Wiesenfeld K Gammaitoni L Hänggi P Ditto W 2000 Phys. Rev. 62 317
[17] Schmid G Hänggi P 2005 Physica 351 95
[18] Grigorenko A N Nikitin P I Roschepkin G V 1996 J. Appl. Phys. 79 6113
[19] Jin Y F Xu W Xu M 2005 Chin. Phys. Lett. 22 1061
[20] Machura L Kostur M Luczka J 2010 Chem. Phys. 375 445
[21] Du L C Mei D C 2011 Physica 390 3262
[22] Wu J Xu Y 2014 Discrete Dyn. Nat. Soc. 2014 850361
[23] Saikia S 2014 Physica 416 411
[24] Hennig D Schimansky-Geier L Hänggi P 2009 Phys. Rev. 79 041117
[25] Lindner B Schimansky-Geier L Reimann P Hänggi P Nagaoka M 1999 Phys. Rev. 59 1417
[26] Kang Y M Xu J X Xie Y 2003 Acta Phys. Sin. 52 802 in Chinese
[27] Kang Y M Xu J X Xie Y 2003 Phys. Rev. 68 036123
[28] Xiao S M Jin Y F 2017 Nonlinear Dyn. 90 2069
[29] Liu K H Jin Y F 2013 Physica 392 5283
[30] Jin Y F Xie W X Liu K H 2017 Procedia IUTAM 22 267
[31] Xu Y Wu J Zhang H Q Ma S J 2012 Nonlinear Dyn. 70 531