Fundamental and progress of Bi2Te3-based thermoelectric materials
Project supported by the Australian Research Council. Zhi-Gang Chen thanks the USQ start-up grant and strategic research grant.
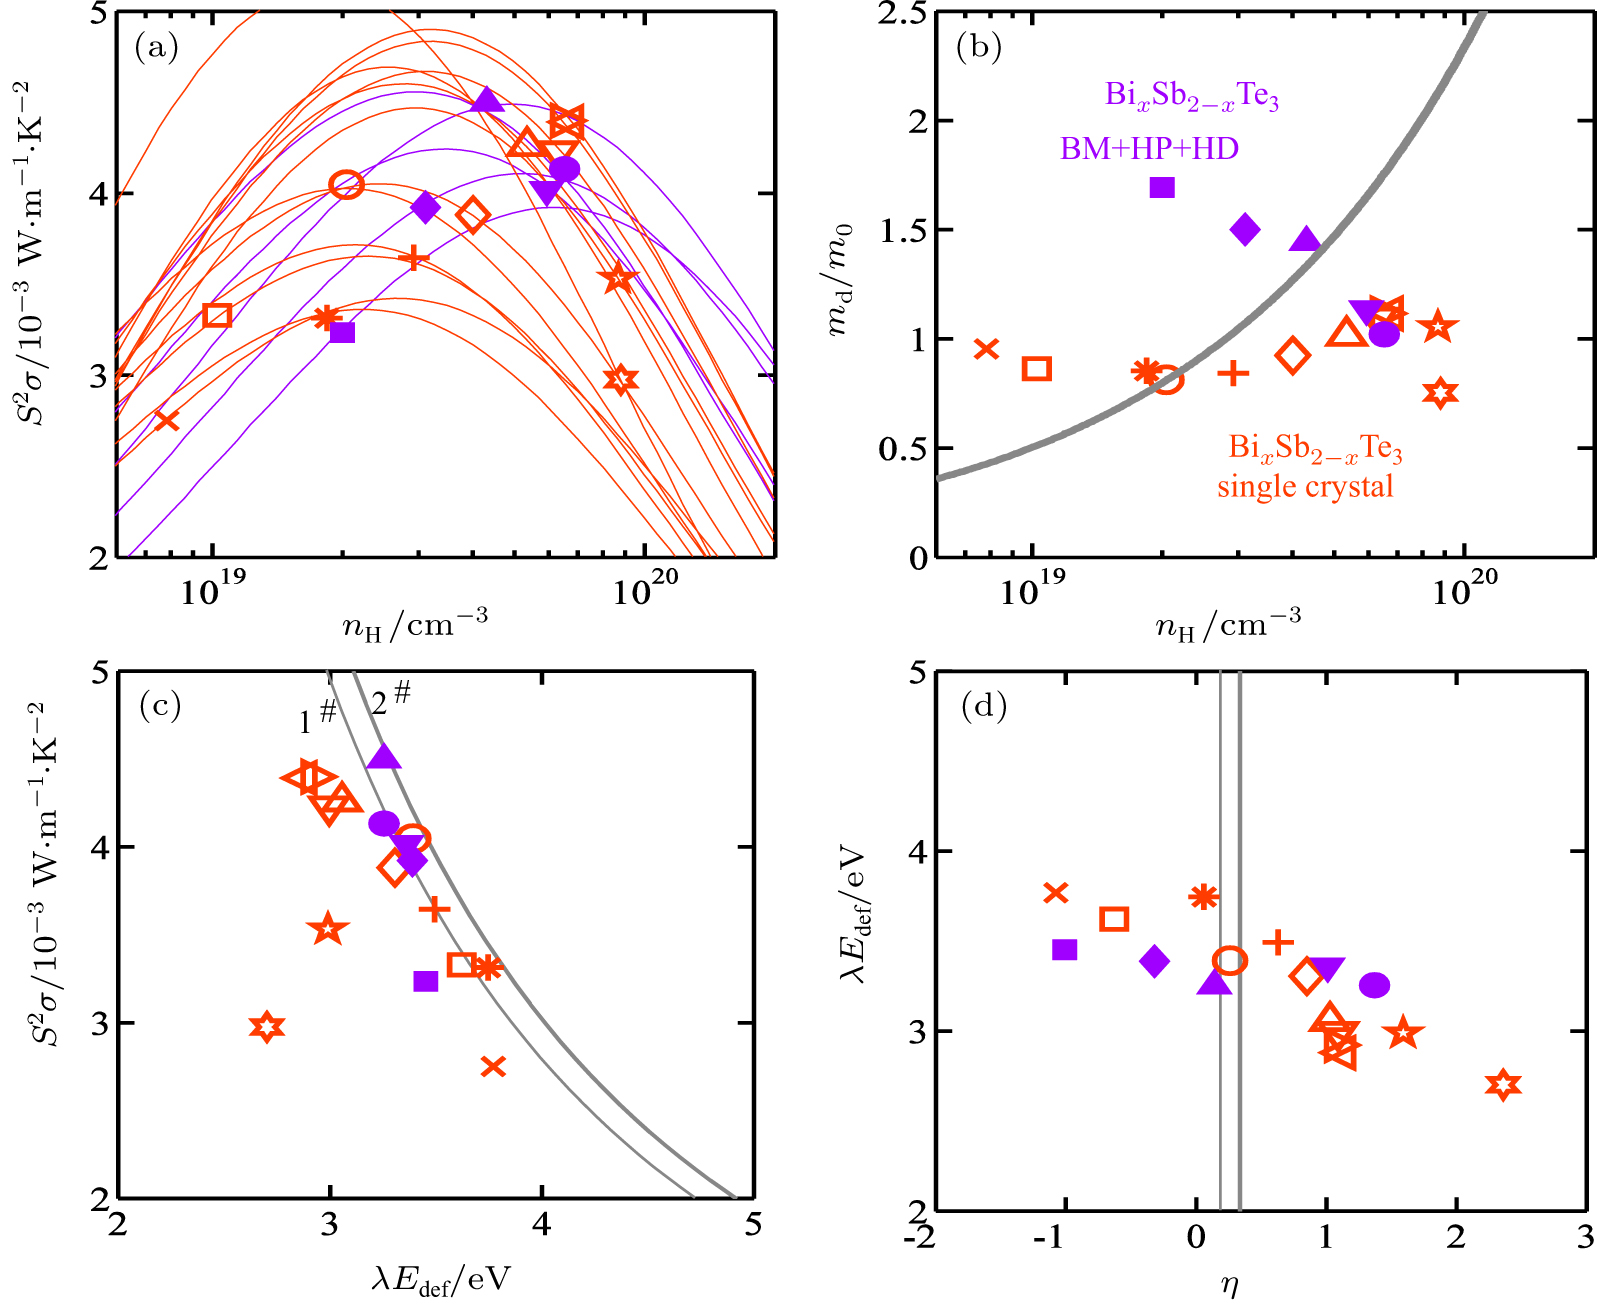
(color online) (a) Data points of

Fundamental and progress of Bi2Te3-based thermoelectric materials Project supported by the Australian Research Council. Zhi-Gang Chen thanks the USQ start-up grant and strategic research grant. |
(color online) (a) Data points of |
 |