† Corresponding author. E-mail:
The structures and elasticities of phase B silicates with different water and iron (Fe) content are obtained by first-principles simulation to understand the effects of water and Fe on their properties under high pressure. The lattice constants a and b decrease with increasing water content. On the contrary, c increases with increasing water content. On the other hand, the b and c decrease with increasing Fe content while a increases with increasing Fe content. The decrease of M (metal)–O octahedral volume is greater than the decrease of SiO polyhedral volume over the same pressure range. The density, bulk modulus and shear modulus of phase B increase with increasing Fe content and decrease with increasing water content. The compressional wave velocity (Vp) and shear wave velocity (Vs) of phase B decrease with increasing water and Fe content. The comparisons of density and wave velocity between phase B silicate and the Earth typical structure provide the evidence for understanding the formation of the X-discontinuity zone of the mantle.
Water and iron play important roles in the Earth evolution and dynamics because they have strong influences on the physical and chemical characters of minerals. Water can be transported into the Earth interior through hydrous minerals in subducting slabs.[1,2] As an important potential hydrous silicate phase, phase B (particular for hydrous phase B) was first identified by Ringwood and Major.[3] The phase B can be synthesized by heating a powder mixture of forsterite and periclase under hydrous conditions, above 15 GPa and 1500 °C, and will be decomposed into an assemble of liquid and periclase above its incongruent melting temperature (2300 °C at 23 GPa).[4] Akaogi and Akimoto[5] synthesized phase B with a crystal structure of Mg23Si8O42H6, and this structure was then revised into Mg24Si8O42H4 by Finger et al.[6] Studies about phase equilibrium in the system MgO–SiO2–H2O at 8.5 GPa–16 GPa and 750 °C–1200 °C showed dehydration of phase B might play an important role in the forming of the low-Q low-velocity zone in the depth about 300 km–500 km.[5] Finger et al.[7] described the details of crystallographic data of the phase B and anhydrous phase B (Anhy-PhB) that each SiO6 octahedron shares all 12 edges with neighboring MgO6 octahedra. A large number of edges shared among the octahedral make the high densities of the phase B and Anhy-PhB. The H bonding tends to increase, rather than reduce the structure density because all H bondings in phase B occurs within the humite-like layer, rather than between layers. The Anhy-PhB, which possesses the Mg end-member stoichiometry of Mg14Si5O24, was first synthesized by Herzberg and Gasparik.[8] Ganguly and Frost[9] determined the stability of Anhy-PhB and the equilibrium boundary of the reaction forsterite + periclase = anhydrous phase B at 900 °C–1600 °C, and suggested that the reaction might lead to the formation of the X-discontinuity at 275 km–345 km depth in the subcontinental and subduction zone. High-pressure single crystal x-ray diffraction results of the Anhy-PhB at 7.3 GPa and room temperature show that the c-axis is most compressible (Kc = 137.3 GPa) and the b axis is least compressible (Kb = 175.4 GPa), and the rigid edge-sharing chains of MgO6 and SiO6 octahedra in the octahedral layer control its compressibility.[10] The thermo-chemical and -physical properties of the Anhy-PhB were simulated using hybrid B3LYP density functional theory from 0 to 20.3 GPa and the results are in agreement with the experimental data.[9–11] The partitioning of Fe into one of the six symmetrically distinct octahedral sites made the properties of Fe-bearing phase B (Mg0.88Fe0.12)14Si5O24 (Fe-PhB), synthesized at 15 GPa and 1800 °C, remarkably different from those of phase B and the presence of Fe expands the stability of anhydrous phase B into the Earthʼs transition zone.[12] The properties of minerals under high pressure are important for understanding the structure and composition of the Earth. However, the research of the crystal structural and elastic properties of the phase B (including phase B, Anhy-PhB and Fe-PhB) under high pressure has been relatively rare. Only two results about crystal structures of Anhy-PbB were reported.[10,11] Theoretical simulations can establish a link between the experimentally observed peaks in the spectra and the underlying atomic dynamics and structure. First principles have been successfully applied to geosciences for understanding mineral properties of the crystal structure, elasticity, diffusion, melt, etc. under high pressure and temperature.[13–24] Differences among the different cases of phase B with different water and Fe content are important for understanding the effects of water and Fe content on mineral properties, the structure and composition of the mantle. Therefore, we investigate the crystal structural and elastic properties of Anhy-PhB, phase B, and Fe-PhB under high pressure by using first-principles calculations.
The anhy-PhB and Fe-PhB are orthorhombic (Pmcb, Z = 2) phases with 43 atoms per unit cell. When Fe is present, it is positioned into one of the six symmetrically distinct octahedral sites, although it prefers the M3 position.[8] For the Fe atom, we did not calculate spin polarized. In contrast, the phase B crystallizes into the space group P21/C (Z = 4) with 39 atoms per unit cell.[5] All the above phases involve the ordered intergrowth of two structural elements along the b-axis direction. One is a layered structure containing octahedrally coordinated Mg and tetrahedrally coordinated Si. The other is the layered structure only containing octahedrally coordinated Mg and Si.[6]
In this study, first-principles calculations are performed by using density functional theory[25,26] with the plane-wave pseudopotential. The calculations are implemented in the CASTEP code,[27] and the generalized gradient approximation (GGA) with PW91 parameterization[28] is used to describe exchange–correlation interactions. Ultrasoft pseudopotentials[29] are used to model electron–ion interactions with a plane-wave energy cutoff of 700 eV. A 3 × 1 × 2 Monkhorst Pack grid of k-points is adopted for sampling the Brillouin zone. A convergence criterion of 5 × 10⁻⁷ a.u. for total energy is used in the self-consistent-field calculations.
The structures of the phase B at given pressures are calculated by simultaneously optimizing both atomic positions and lattice constants under Hellmann–Feynman forces and stresses acting on nuclei and lattice parameters, respectively.[30] The elastic constants are determined by stress–strain relations.[31] The magnitudes of all applied strains are 0.003 and the linear relation was ensured to be enough for this strain range.
To assess the performance of the total-energy density functional theory approach used here, we calculate the cell parameters and elastic constants of the Anhy-PhB, phase B, and Fe-PhB and compare them with the reported values (Table
| Table 1.
Structural and elastic constants of phase B. . |
As shown in Table
Lattice constants (a, b, and c) of the phase B are calculated from 0 GPa to 30 GPa (Fig.
 | Fig. 1. (color online) Lattice constants of phase B varying with pressure (P). Different results are indicated by superscript numbers as follows: 1: this study; 2: Ottonello et al.[11]; 3: Crichton et al.;[10] 4: Hazen et al.;[12] 5: Finger et al.;[6] 6-Crichton et al.[32] |
The lattice constants a and b decrease with increasing water content, on the contrary c increases with increasing water content. The lattice constants b and c decrease with increasing Fe content, on the contrary a increases with increasing Fe content. Different occurrences of H and Fe atoms in crystal structure of the phase B lead to those different effects.
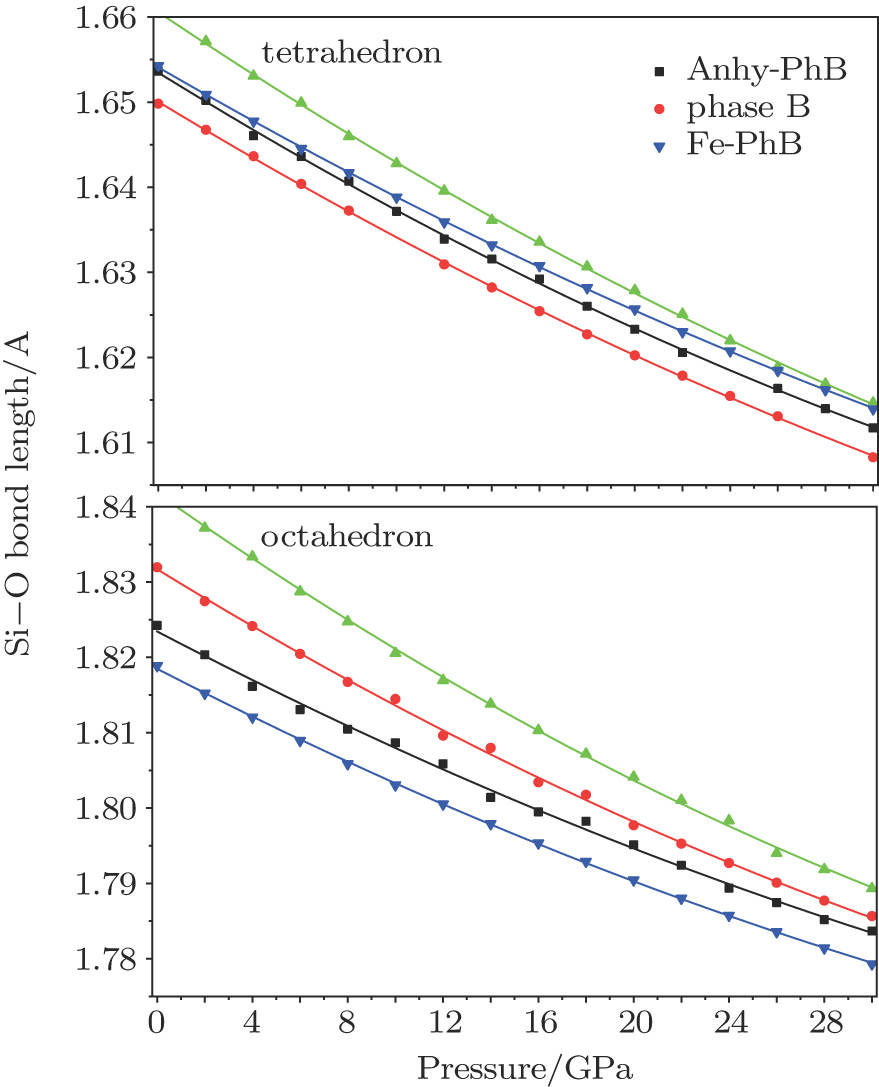
The changes of lattice parameters (e.g., bond length, bond angle, and polyhedral volume) with pressure are important for understanding mineral properties under high pressure. Because there are several different Si–O tetrahedra/octahedra along with M(Mg/Fe)–O octahedra in phase B, the lengths of Si–O and M–O bonds differ from each other within individual phases, but the differences are very slight. Therefore, we calculate the mean Si–O bond distance and M–O bond distance in each phase B. Hereafter, the calculated bond lengths in this study refer to these mean values.
The lengths of Si–O bond of a tetrahedron are shorter than those of an octahedron (Fig.
Metal(Fe/Mg)–O (MO) octahedron plays an important part in the crystal structure of phase B. The M–O octahedral bond distances of the phase Bs are shown as a function of pressure in Fig.
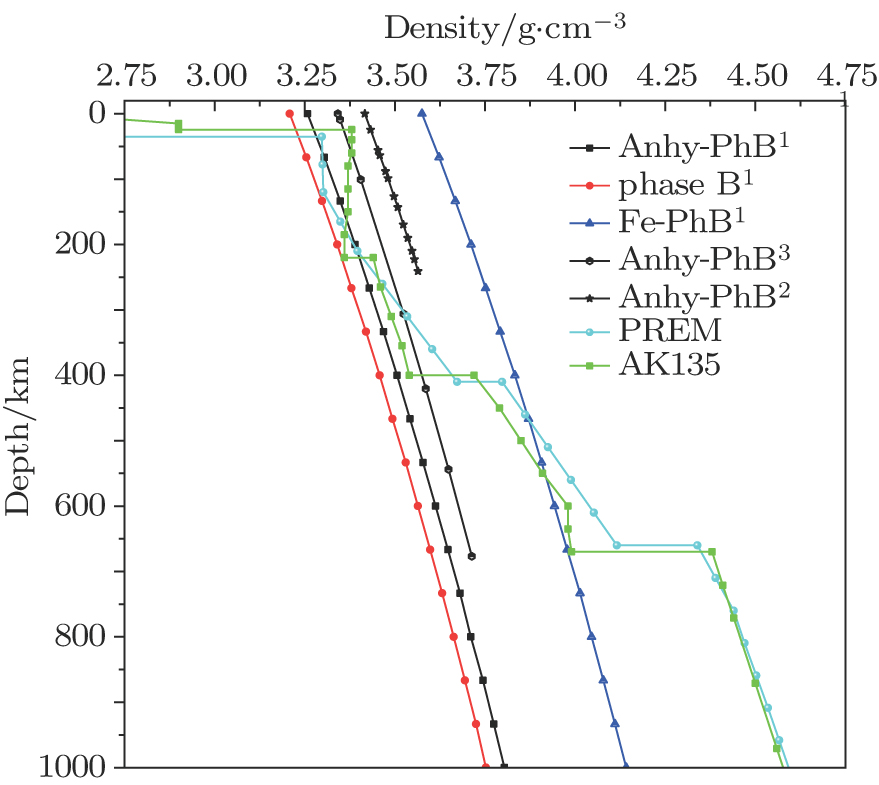
The densities of the phase B and typical Earth density structure are shown in Fig.
 | Fig. 4. (color online) Densities of phase B along the Earthʼs typical density structure. The different results are indicated by superscript numbers as follows: 1: This study; 2: Ottonello et al. 2010;[11] 3: Crichton et al. 1999.[10] |
The densities of Anhy-PhB and phase B are close to the Earth density structure at depths of ∼50 km–410 km. However, the density of Fe-PhB is much higher than the Earth density within this depth range. The deeper the depth in the Earth (∼410 km–670 km), the closer to the Earth density the density of Fe-PhB becomes. However densities of the phase B and Anhy-PhB become smaller than the Earth density. The formation of Anhy-PhB by the reaction between forsterite and periclase may be responsible for the X-discontinuity at ∼260 km–330 km depth of the mantle.[9] The densities of the phase B in this depth range are close to the Earth density, which gives evidence for the formation of X-discontinuity at the mantle.
The elastic parameters of minerals and their dependence on pressure are important in the Earth science because these properties are related to geophysical properties (e.g., seismic velocity and Poissonʼs ratio).
The bulk modulus (K) and shear modulus (G) increase with increasing Fe content and decrease with increasing water content (Fig.
The effects of the Fe and water content on the elastic modulus of phase B presented herein are consistent with the general trends in elastic behavior with water and Fe contents of minerals changing.[33,35–37] For better understanding the elastic properties of phase B under high pressure and the effects of water and Fe, the 9 main elastic constants of the three cases of phase B are also listed as supplementary in Table
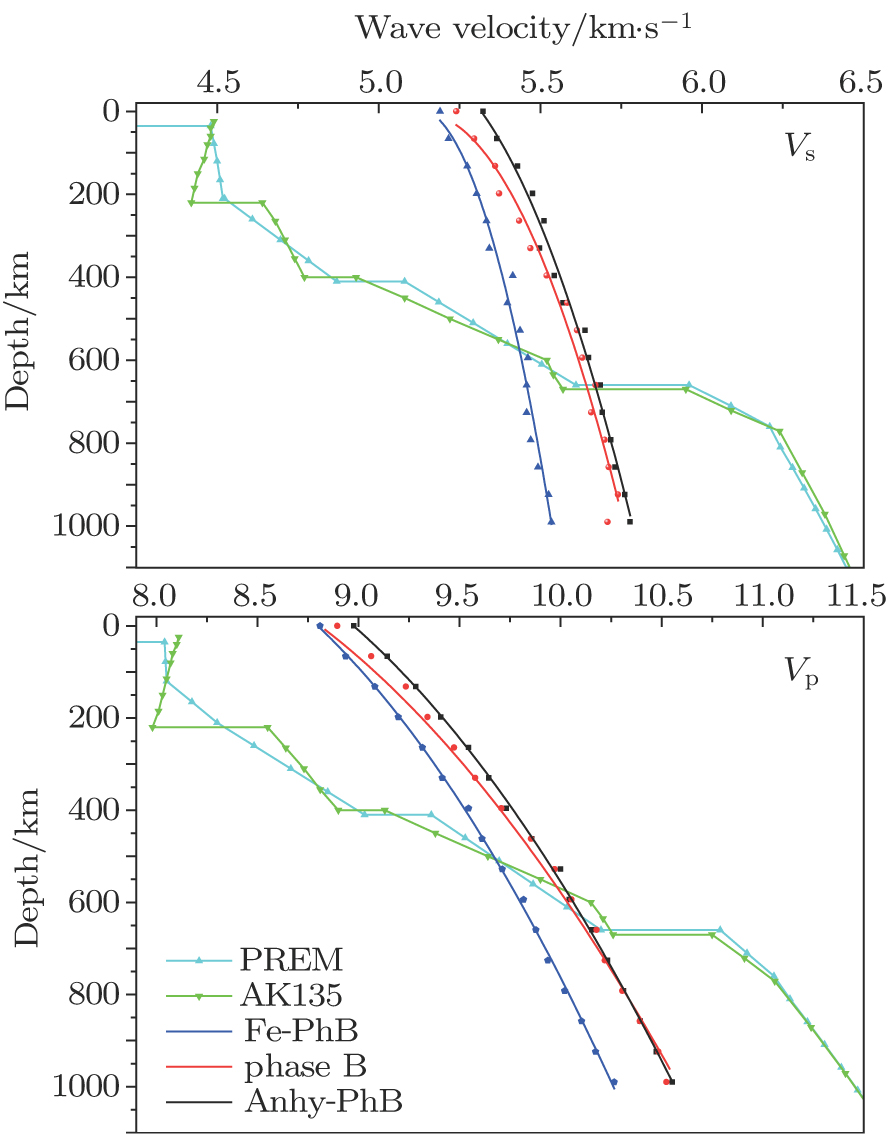
The wave velocity of a mineral is an important parameter for investigating the composition of deep Earth via comparison with the wave velocity structure of the Earth. The wave velocities for different cases of phase B under high pressure are plotted along with the typical Earth velocity structure in Fig.
 | Fig. 6. (color online) Plots of the Earth depth versus wave velocity (Vs and Vp) for different cases of phase B. |
The compressional and shear wave velocities of the phase B are higher than the Earthʼs velocity where the depths are less than about 450 km and 550 km, respectively. Then the velocities of the phase B become close to the Earth velocity at which depths are from about 550 km to 670 km. Phase B is thought to be stable at the depth of the mantle transition zone.[4] The formation of anhydrous phase B by the reaction between forsterite and periclase may be responsible for the X-discontinuity at ∼260 km–330 km depth of the mantle.[9] At the same time, the wave velocities of phase B are higher than those of olivine/forsterite.[42–44] So our results provide evidence for the stability zone and the formation of an X-discontinuity zone of the mantle.
The different ways for Fe and water atoms to occur in phase B structure (Fe occurs in phase B structure by substituting Mg, and H occurs within the humite-like layer of phase B), make different effects of water and Fe on lattice constants. The result helps to understand the influence mechanisms of water and Fe on properties of minerals. The decrease of M–O octahedral volume is greater than the decrease of SiO polyhedral volume over the same pressure range. The bulk modulus and shear modulus increase with increasing Fe content but decrease with increasing water content. The compressional wave velocity and shear wave velocity of phase B decrease with increasing water and Fe content. The results of density and wave velocity of phase B provide evidence for understanding the formation of the X-discontinuity zone of the mantle. However, the behaviors of phase B with different water or Fe content at high temperature need further investigating.


