Conductivity and band alignment of LaCrO3/SrTiO3 (111) heterostructure
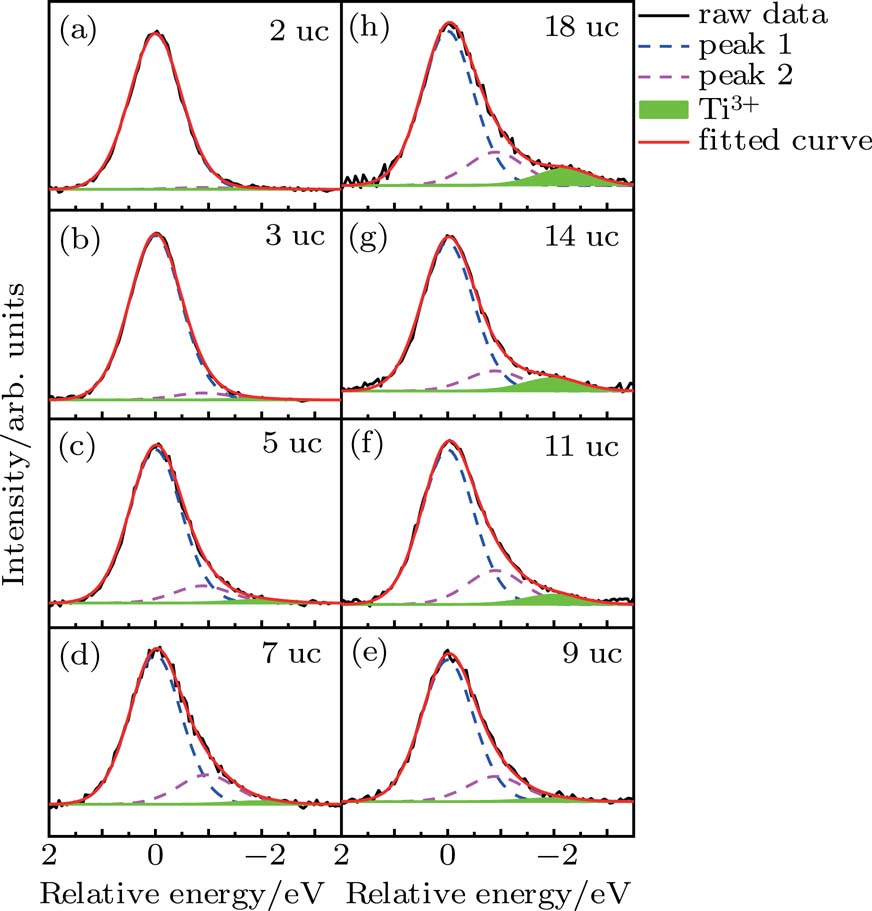
(color online) Peak decompositions of the Ti-2p3/2 spectra in LCO/STO (111) with various LCO thickness values. The spectra are shifted to the Ti4+ main peak (dashed blue). The green area highlights the Ti3+ peak and the red solid line presents the fitted curve. Before fitting, a Shirley background is subtracted from the raw data.
