|
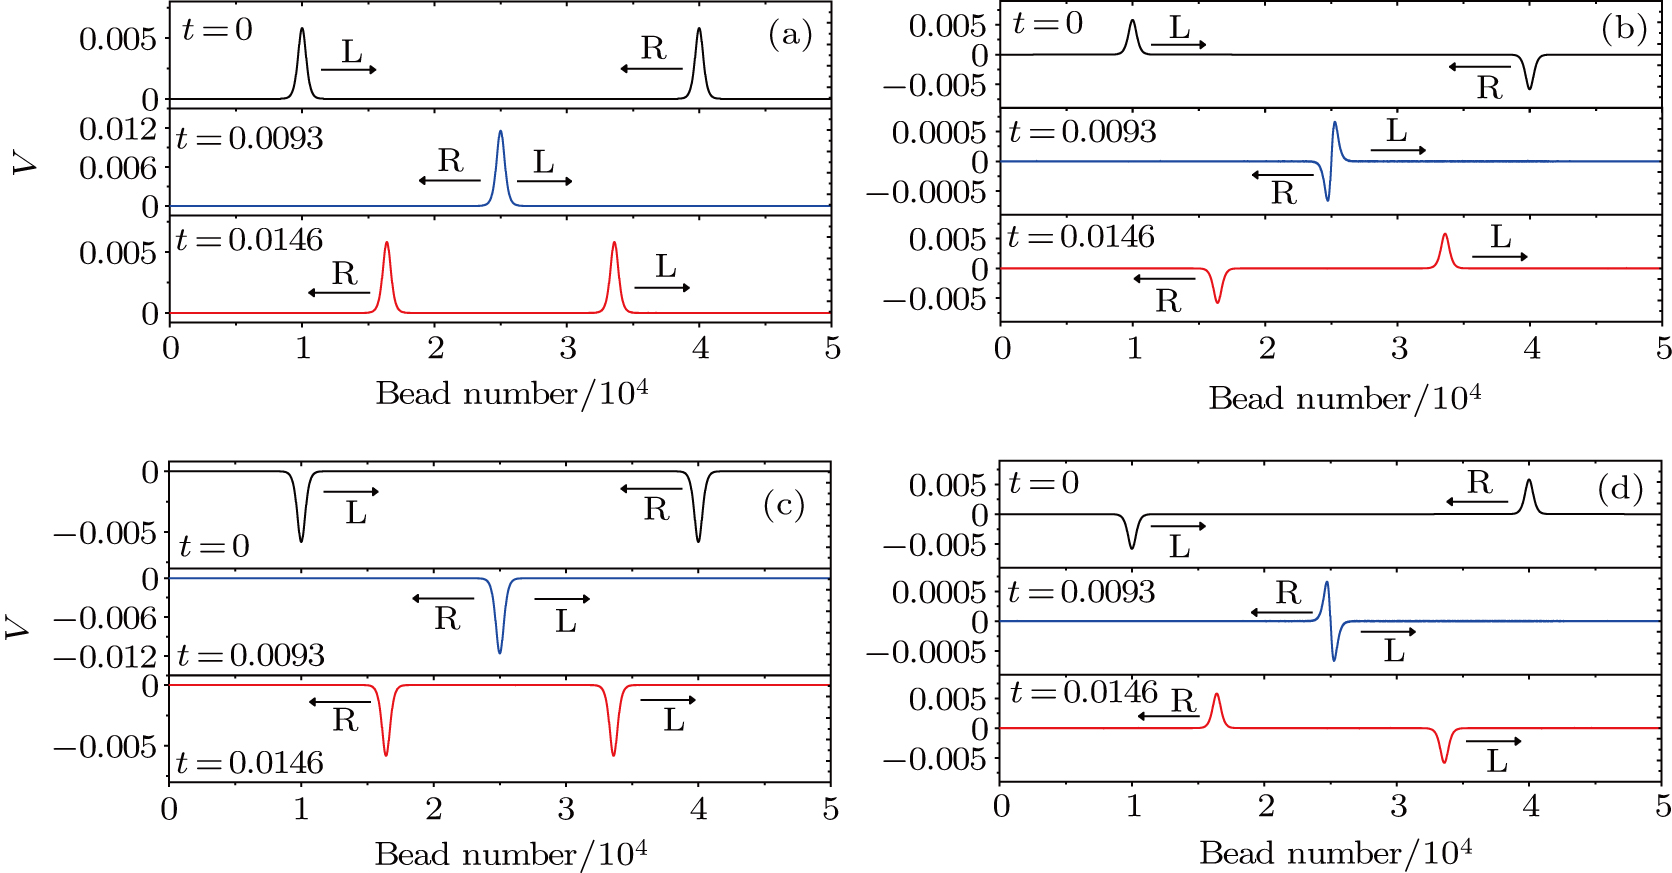
(color online) The interaction process of head on collision between two solitary waves. Panels (a), (b), (c), and (d) correspond to the four cases. L and R represent the left and right solitary waves, where AL = 0.00582 and AR = 0.00582. The arrows stand for the propagation directions of waves. The black solid line represents the initial state of the solitary waves of L and R, the blue solid line represents the wave profile at the critical point when the maximum amplitude is reached during the collision between two solitary waves. The red solid line represents the evolution of solitary waves L and R after collision. Four different cases are shown in panels (a), (b), (c), and (d). Case (a) is for
A
+
L
&
A
+
R
, case (b) for
A
−
L
&
A
−
R
, case (c) for
A
+
L
&
A
−
R
, and case (d) for
A
−
L
&
A
+
R
. Here A
L and
A
R
represent amplitudes of solitary waves L and R, respectively, while “+” and “−” represent the propagation directions of solitary waves, respectively.
|