† Corresponding author. E-mail:
A compact prototype based on mid-infrared wavelength modulation spectroscopy (WMS) is developed for the simultaneous monitoring of NO, NO2, and NH3 in the urban area. Three quantum cascade lasers (QCLs) with central frequencies around 1900.0 cm−1, 1600.0 cm−1, and 1103.4 cm−1 are used for NO, NO2, and NH3 detections, respectively, by time-division multiplex. An open-path multi-pass cell of 60-m optical path length is applied to the instrument for high sensitivity and reducing the response time to less than 1 s. The prototype achieves a sub-ppb detection limit for all the three target gases with an average time of about 100 s. The instrument is installed in the Jiangsu environmental monitoring center to conduct performance tests on ambient air. Continuous 24-hour measurements show good agreement with the results of a reference instrument based on the chemiluminescence technique.
As the precursors of secondary fine particulate matters, NO, NO2, and NH3 in the air have been causing global environmental issues. NOx participates in a chain reaction that destroys the protective stratospheric ozone layer, resulting in an increase of ultraviolet radiation reaching the surface of the Earth.[1] Also, NOx promotes acid rain that causes soil acidification and affects the growth of plants.[2] Moreover, NOx plays an important role in forming photochemical smog.[3] Therefore, it is essential to reliably measure the NOx concentration in ambient air, as one of the most abundant nitrogen-containing molecules, ammonia, has important effects on atmospheric chemistry and the environment. The major ingredient is alkaline gas, and therefore it plays an important role in neutralizing the acidic gases and forming the particulate matters. However, NH3 adsorption onto the sampling manifolds can result in significant discrepancies between the measured and actual concentrations.[4] Open-path arrangements can help to make accurate measurements without being affected by adsorption.[5,6]
In recent years, the detecting of NO, NO2, and NH3 based on infrared WMS[7–10] has been widely studied for industrial processes, environmental monitoring and medical diagnoses. For example, a quantum cascade laser (QCL)[11,12] with a center wavelength ∼5263 nm was used to detect NO emission.[2] With a resolution of line strength, a resolution about 2 ppm was realized and the relative error was less than 3%. In order to estimate the NO and NO2 background level in the free troposphere, a QCL-based absorption spectrometer was employed at the high-altitude site Jungfraujoch (3850 m a.s.l) in Switzerland.[13] The precisions of 10 ppt and 3 ppt for NO and NO2 were achieved under field conditions with 180-s averaging time, resepectively. The linear dynamic range of the instrument for both species increased up to 45 ppb. Also, it is essential to measure NO and its metabolites in various body compartments to enhance our understanding of biology. Wang et al. presented a mid-IR Faraday rotation spectrometer for detecting the NO isotopes with detection limits of 3.72 ppbv/Hz1 / 2 for 14NO and 0.53 ppbv/Hz1 / 2 for 15NO, respectively.[14] Generally, a single-laser system is less complex and consumes less power than systems using multiple laser modules. Jagersk et al. presented the practical realization of such a pulsed QCL dual-wavelength setup, which emitted single-mode radiation at 1600 cm−1 and 1900 cm−1 and was suited for simultaneously detecting NO and NO2.[15] In industrial processes, the NOx emission in exhaust gasses was strictly restricted, whereas ammonia was widely used in flue gas treatment for deNOx applications. Therefore, a highly sensitive setup based on near-infrared lasers for the detection of excess NH3 has been investigated.[16] The extractive gas cell was heated to a temperature of 180 °C to avoid condensing the moisture and sticking the ammonia molecules. For an ammonia breath sensor, using absorption lines located at the near-infrared absorption band may not satisfy the demand for detection limit. A calibration-free ammonia sensor using a QCL with the WMS technique was demonstrated for monitoring the ammonia in exhaled breath.[17] The minimum detectable ammonia mole fraction was found to be 7 ppb with a 76.45-m long extractive multi-pass gas cell. Compared with the extractive type, the open-path sensor configuration minimized sampling artifacts associated with NH3 surface adsorption onto the inlet tubing.[18] This open-path sensor has a sensitivity and noise-equivalent limit of 0.15-ppbv NH3 at 10 Hz.
To be able to do further research on the formation of secondary fine particulate matters, we report the development of a QCL-based instrument for monitoring NO, NO2, and NH3 in the open air. Three absorption lines located at 1900.0 cm−1, 1600.0 cm−1, and 1103.4 cm−1 were selected for detecting NO, NO2, and NH3 respectively, where the line strengths were two orders stronger than those in the near-infrared absorption region. In contrast to closed-path systems, our non-destructive open-path design minimized the challenges of sampling artifacts and provided a fast time response. The time division multiplexing technology and second harmonic analysis with WMS can be used to simultaneously detect NO, NO2, and NH3 at a sub-ppb level. To test its reliability and long-term operation, the prototype was installed in the Jiangsu environmental monitoring center and compared with the measuring instrument based on chemiluminescence in the center.
When a QCL injection current is modulated by a sinusoidal modulation signal, the laser frequency ν(t) and output intensity I(t) can be expressed as


Expand the transmittance in Fourier series of laser angular modulation frequency and its harmonics kω
In the experiment, a digital lock-in amplifier with appropriate parameters was used to attain the first and second (i.e., 1f and 2f) harmonic signal of the transmitted light intensity through the gas sample. By normalizing the 2f signal against the magnitude of the 1f signal, the dependence on laser intensity was eliminated. To a good approximation, the amplitude of the normalized 2f signal was found to be
After the line strength, the air pressure and optical path length have been predetermined, and the gas concentration can be acquired based on Eq. (
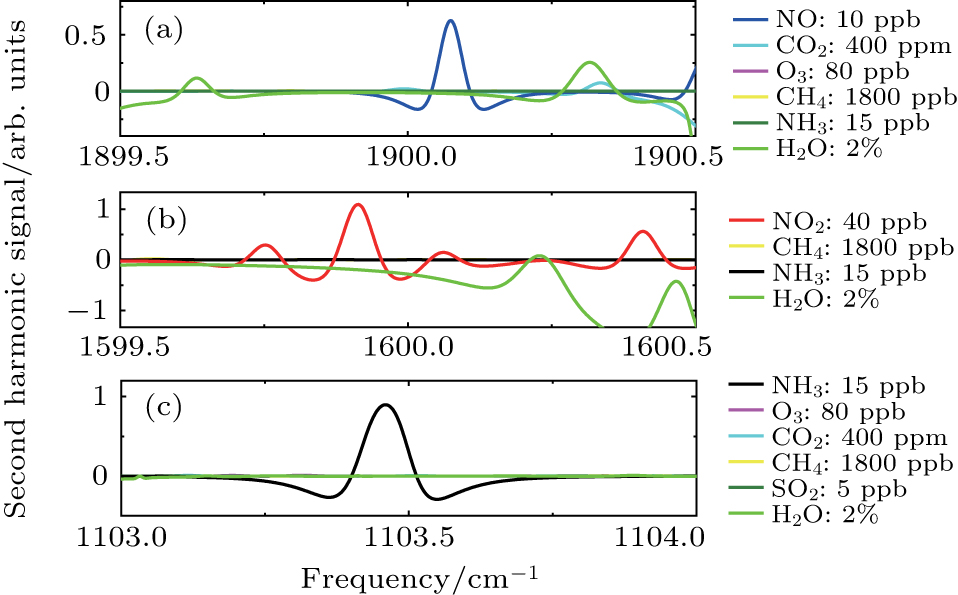
Since the detection was performed on ambient air with an open-path setup, water vapor, carbon dioxide and other species in the air may cause interferences due to their overlapping absorption features or pressure broadening effects. Therefore, spectral features in the ranges of 1900.0 cm−1, 1600.0 cm−1, and 1103.4 cm−1 were selected for NO, NO2, and NH3, where their absorption features overlap with the minimum of the adjacent interfering gas absorption feature, and the line strength was relatively strong. To demonstrate the feasibility further, the detailed simulations of absorption spectra of NO, NO2, and NH3, together with typical ambient mixing ratios of atmospheric absorbers were performed. Figure 
 | Fig. 1. (color online) Direct absorption HITRAN simulations of (a) NO, (b) NO2, and (c) NH3, with typical ambient mixing ratios of atmospheric absorbers, based on 60-m path length, 296 K, 1 atm. |
The schematic diagram of the open-path sensor is shown in Fig.
 | Fig. 3. (color online) Schematic diagram of an open-path instrument for atmospheric gas sensing, based on the wavelength modulation spectroscopy technique and mid-infrared quantum cascade lasers. |
In the experiment three 50-Hz-frequency time division multiplexing sawtooth ramp signals superimposed with a 30-kHz-frequency sinusoidal signal were used to modulate laser injection currents. The ramp and modulation signals were generated by a data acquisition device (DAQ, NI-USB 6363, 16-bit resolution). Three QCLs output beams were combined by wedged dielectric beam splitters (


The output beams from the multi-pass cell were focused onto a room-temperature MCT photodiode (Vigo, PC-2TE) by an off-axis parabolic mirror (f = 50.4 mm) and fine adjustment was made to optimize the detector signal. Data acquisition of the detector output signal was performed by the same DAQ card with a sampling rate of 2 MHz and a resolution of 16 bits. The raw spectral signal was averaged over 50 scans to enhance the signal-to-noise ratio. In operation, digital lock-in processing of the acquired data can be performed in real time, which led to a response time of 1 s. Meanwhile, ambient temperature (T) and pressure (P) were recorded with measuring equipment (OMEGA, iBTHX). The measuring accuracies of temperature and pressure were 0.5 °C and 2 mbar (1 bar = 105 Pa), respectively. The concentration detection responsivities of the instrument at T and P (see Eq. (

The sweep cycle rate of time division multiplexing signals is interleaved at 50 Hz and the fast modulation frequency is at 30 kHz. When QCLs are not in the emitting state, their bias currents are set slightly below their thresholds without emitting any light or causing interference. This method of operating the laser current just below its threshold rather than turning off the current completely avoids rapidly declining the injection current and helps to achieve a longer operational lifespan for the lasers. In addition, the time division multiplexing technique reduces the average light-emitting time of QCLs as well as the produced heat, and improved the thermal stability of the system. Another reported approach is to modulate each of the lasers at different frequencies. This required complex signal demodulation also increases the photodetectorʼs total amount of received light emitted by multiple lasers, which will contribute to higher noise.
Since the modulation depth varies with modulation voltage directly, an appropriate modulation voltage is required to maximize the 1f-normalized 2f amplitudes of NO, NO2, and NH3. We investigate the modulation characteristics by using the fixed concentrations of NO, NO2, and NH3 in the 25-cm reference cell alternatively and by filling the enclosed open-path cell with pure N2. The amplitudes of NO, NO2, and NH3 1f-normalized 2f signals at different modulation voltages are recorded in Fig.
 | Fig. 4. (color online) 1f-normalized 2f signal amplitudes of (a) NO, (b) NO2, and (c) NH3 at different modulation depths. |
 | Fig. 5. (color online) Calibrations of the detection responsivity of the instrument for (a) NO, (b) NO2, and (c) NH3. |
Due to the large volume of the 60-m-long multi-pass cell and the sticky characteristics of NOx and NH3, serious deviations may be introduced when we calibrate this system directly with gas samples at a ppb level. According to the Specifications and Test Procedures for the Ambient Air Quality Continuous Automated Monitoring System promulgated by the Chinese Ministry of Environmental Protection,[20] the 2.5-cm-diameter short reference-gas cell can be used for accurate in-line calibration. While examining the responses of the system at different concentrations of gas samples, the multi-pass cell is enclosed and purged with pure N2 gas. After calibration is finished, the enclosure is removed and the reference cell is filled with pure N2. For an open-path setup, this approach minimizes the calibration deviations and prevents the open-path cell from being contaminated.
The responses of the sensor system at different concentrations of gas samples are studied by using reference gas mixtures (Guangming Research & Design Institute of Chemical Industry, with 2% relative uncertainty). Pure N2 and reference gas samples of NO (10 ppm, 20 ppm, 30 ppm, 40 ppm, 50 ppm), NO2 (5 ppm, 15 ppm, 25 ppm, 35 ppm, 45 ppm), and NH3 (10 ppm, 20 ppm, 30 ppm, 40 ppm, 50 ppm) are injected into the reference cell successively. Due to the characteristics of NOx and NH3 strongly adsorbing the cell surface, an empirical relatively fast gas flow rate of 5 L/min is used to stabilize the cell surface in a short time of ∼5 min. The gas flow of each concentration is maintained for fifteen mins before acquiring stable 1f-normalized 2f signals. The experimental data are recorded for five mins in order to obtain an accurate instrumental response. The peak values of 1f-normalized 2f signals are calculated and the good linear relationships between gas concentration and peak value for different gases are observed as shown in Fig.
The minimum detection limits (MDL) of the system for the three gases are investigated as a function of averaging measurement time. To remove the fluctuation influence derived from concentration fluctuations in the ambient air, a pure N2 purge gas flow is used to fill the laser beam path including the reference cell and the enclosed open-path cell. Continuous measurement results with the three QCLs (for NO, NO2, and NH3, respectively) are recorded for 25 min with time-division multiplex at the 1-Hz cycle rate. Allan variance analysis[21–23] is performed and the results are plotted in Fig.
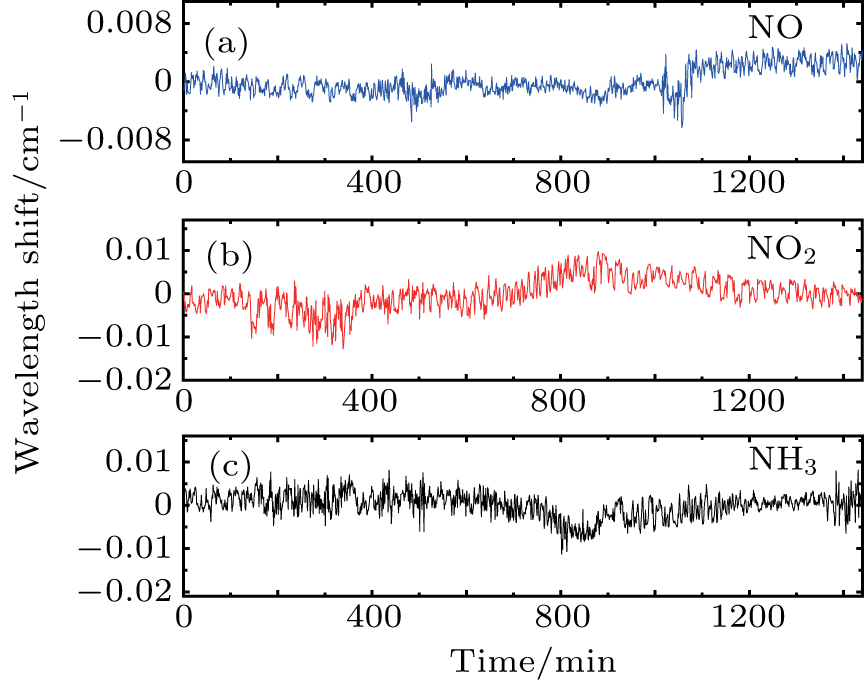
The wavelength stability of QCL is essential as severe wavelength drift may tune the target absorption lines outside of the scanning range. An active wavelength stabilization is an option, but would increase the system complexity and cost. We find that maintaining a high temperature stability is sufficient to minimize the wavelength drift. Since the wavelength drift correlates well with the temperature of the laser case and drivers, the precise temperature control is performed to suppress the drift. An example of 1f-normalized 2f signals of ambient air recorded at 1 Hz is depicted in Fig.
 | Fig. 7. (color online) Measurement examples of 1f-normalized 2f signals of (a) NO, (b) NO2, and (c) NH3 in ambient air. |
The long period monitoring of NO, NO2, and NH3 is performed at the urban site of the Jiangsu environmental monitoring center to examine the reliability and accuracy of the prototype. Restricted by the available laboratory space at the experimental site, our prototype is installed in a laboratory on the third floor of the building in a good ventilation condition, whereas a commercial instrument (Teledyne, model T201) is used for comparison and is placed on the sixth floor, which is about 15 meters above the ground. The observation site is beside a street with relatively heavy traffic. To account for the influence of temperature and pressure variations during a long measurement period, the real-time temperature and pressure are measured and used for correcting the absorption line strengths and 2f amplitudes of the three target gases. The model T201 used for making comparative measurements is based on chemiluminescence (CL) technology[24] with an external thermal converter to give stable and repeatable NO, NO2, and NH3 measurements. The instrument uses an innovative sample path with specially conditioned materials, to preserve gas samples and minimize the interference. A gas mixing system, together with pure N2 and standard gas samples of NO (10 ppm), NO2 (5 ppm), and NH3 (10 ppm) is used to make daily calibration of the instrument at a sub-ppm level. The detection limit of this instrument is 1 ppb in a 10-min sampling time.
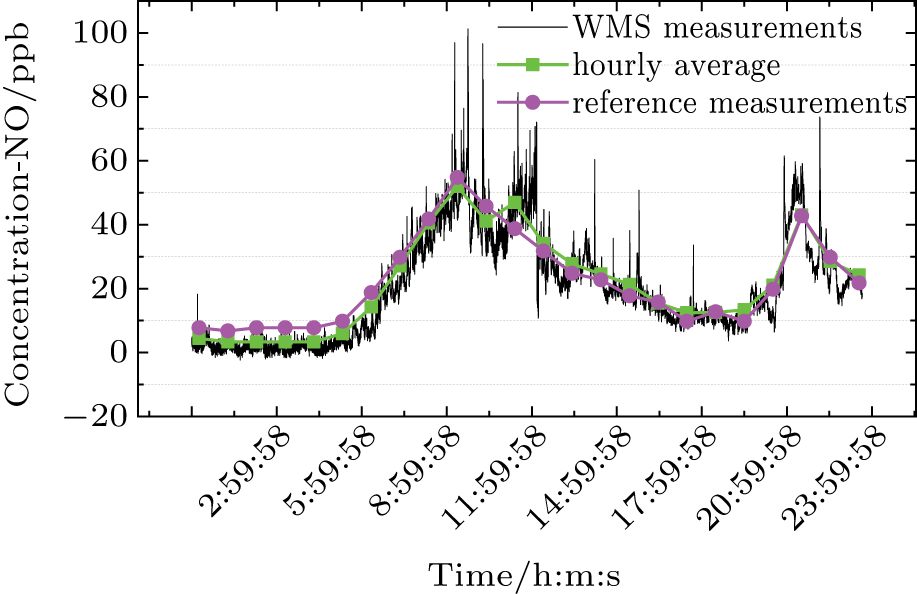
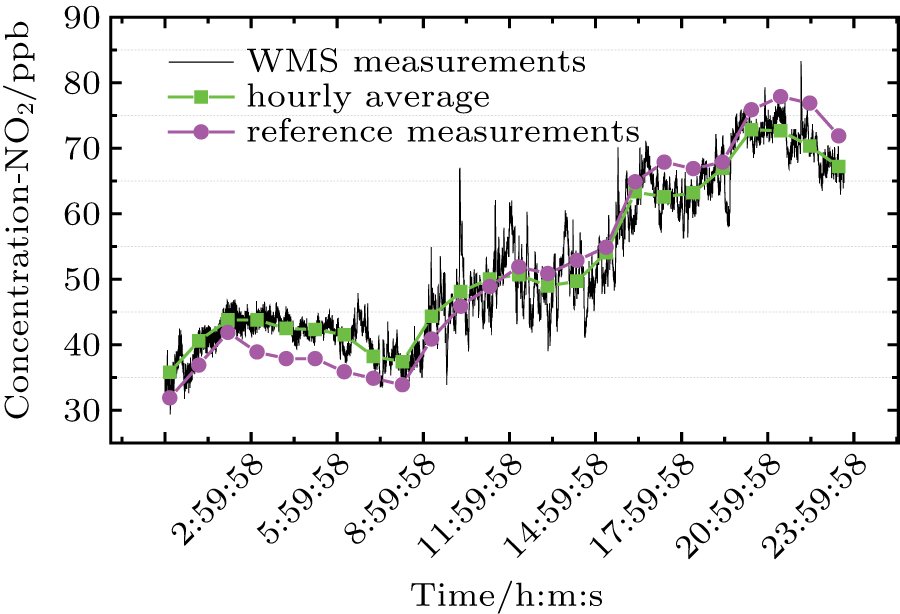
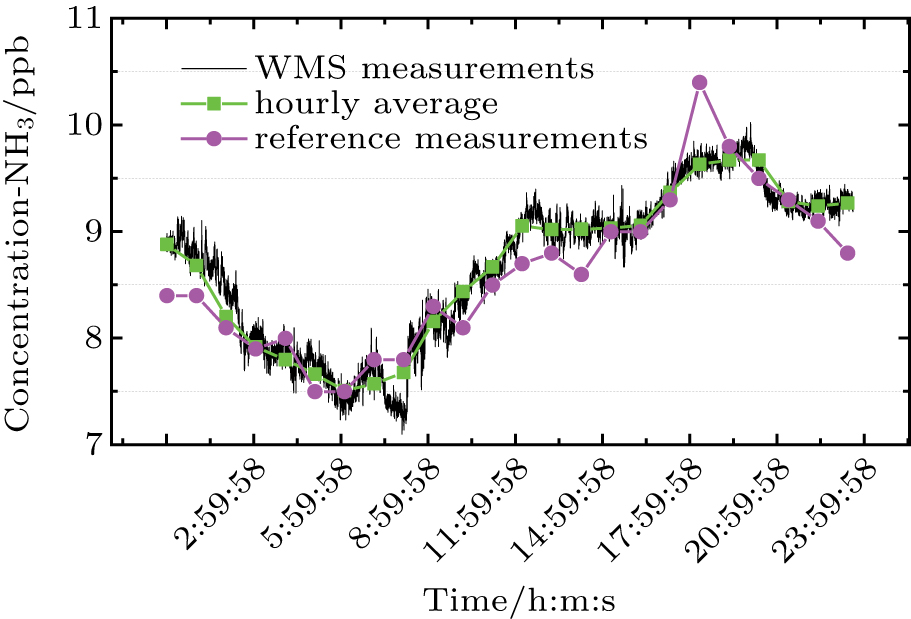
The 24-hour monitoring results of our WMS open-path sensor and the CL reference instrument on November 24, 2016 are shown in Figs.
For the regression analysis, data from the WMS instrument are block-averaged hourly values in order to match the time resolution of the CL instrument. Figure 
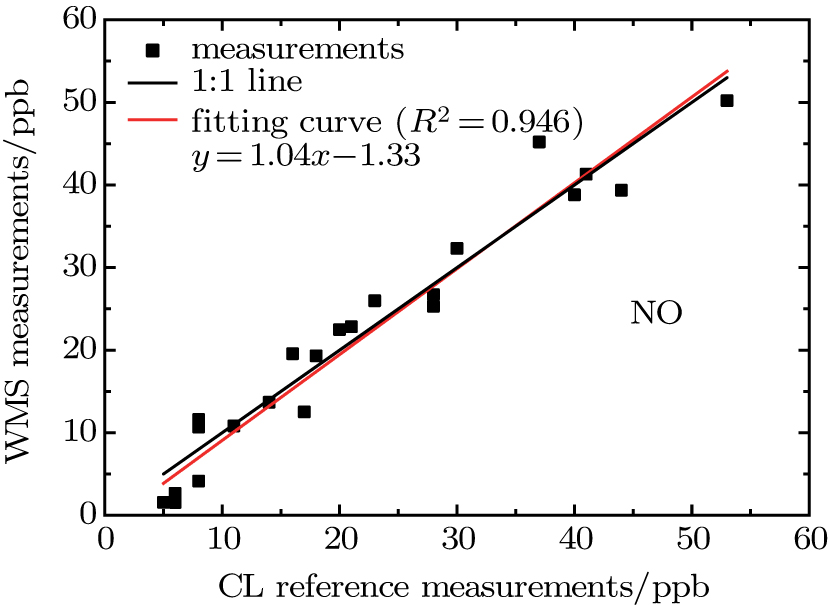 | Fig. 12. (color online) Scatter NO concentration plots of WMS against CL at 1-hour time resolution, including regression line (red) and 1:1 reference line (black). |
 | Fig. 13. (color online) Scatter NO2 concentration plots of WMS against CL at 1-hour time resolution, including regression line (red) and 1:1 reference line (black). |
By applying the time division multiplexing technique to the WMS, an optical instrument for simultaneously monitoring NO, NO2, and NH3 in the air is developed and demonstrated. To realize the gas detection at a sub-ppb level, the QCLs operating in the mid-infrared wavelength region are used, where the target gases have their stronger absorption lines. The time division multiplexing technology reduces the average light-emitting time of QCLs and the produced heat and improves the thermal stability in continuous operation. The instrument shows an excellent linear response to gas sample concentration over a large range. With an optimum integration time of about 100 s, the detection limit for each of all three gases is less than 0.2 ppb. The measurements are well consistent with the measurements by a commercial CL instrument. It should also be noted that our nondestructive open-path design minimizes the challenges of gas sampling artifacts in contrast to extractive sensors. The stability and reliability of the instrument are tested by field measurements and demonstrate that this detecting system is suitable for real-time monitoring NO, NO2, and NH3 in the air with the advantages of quick response, excellent stability and low minimal detection limit. Our future work will focus on continuous monitoring applications in several cities with different meteorological and geographic conditions for several months. Investigations on the reaction and relation among NO, NO2, and NH3 will also be performed to study their influence on the atmosphere.
| [1] | |
| [2] | |
| [3] | |
| [4] | |
| [5] | |
| [6] | |
| [7] | |
| [8] | |
| [9] | |
| [10] | |
| [11] | |
| [12] | |
| [13] | |
| [14] | |
| [15] | |
| [16] | |
| [17] | |
| [18] | |
| [19] | |
| [20] | |
| [21] | |
| [22] | |
| [23] | |
| [24] | |
| [25] | |
| [26] |


