Influence of fluorescence time characteristics on the spatial resolution of CW-stimulated emission depletion microscopy
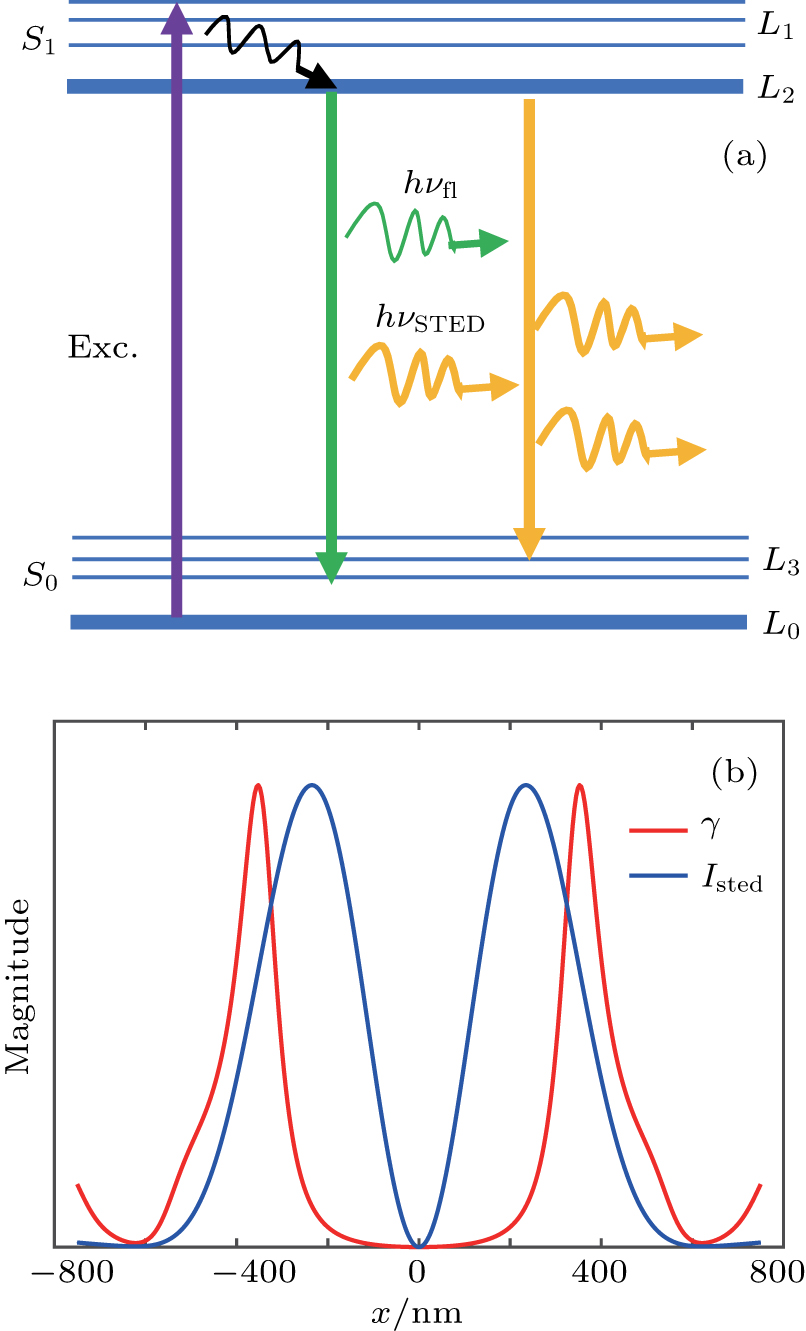
(color online) (a) Schematic of the excitation, emission, and depletion processes of a fluorophore. (b) Schematic profiles of
Influence of fluorescence time characteristics on the spatial resolution of CW-stimulated emission depletion microscopy |
|
(color online) (a) Schematic of the excitation, emission, and depletion processes of a fluorophore. (b) Schematic profiles of |
| |