|
Calculation of electric field–temperature (E, T) phase diagram of a ferroelectric liquid crystal near the SmA–
SmC
α
*
transition
|
Trabelsi F, Dhaouadi H †, Riahi O, Othman T
|
|
|
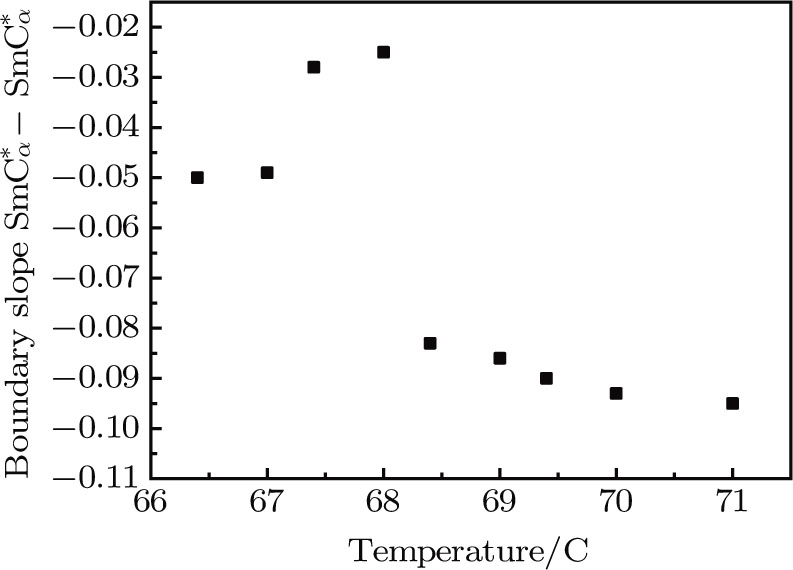
(color online) Curve representing the variation of the slope α (T) of the
SmC
α
*
→
SmC
unwound
*
boundary.
|
|
|
 |
|
|