Calculation of electric field–temperature (E, T) phase diagram of a ferroelectric liquid crystal near the SmA–SmCα* transition
Trabelsi F, Dhaouadi H †, Riahi O, Othman T
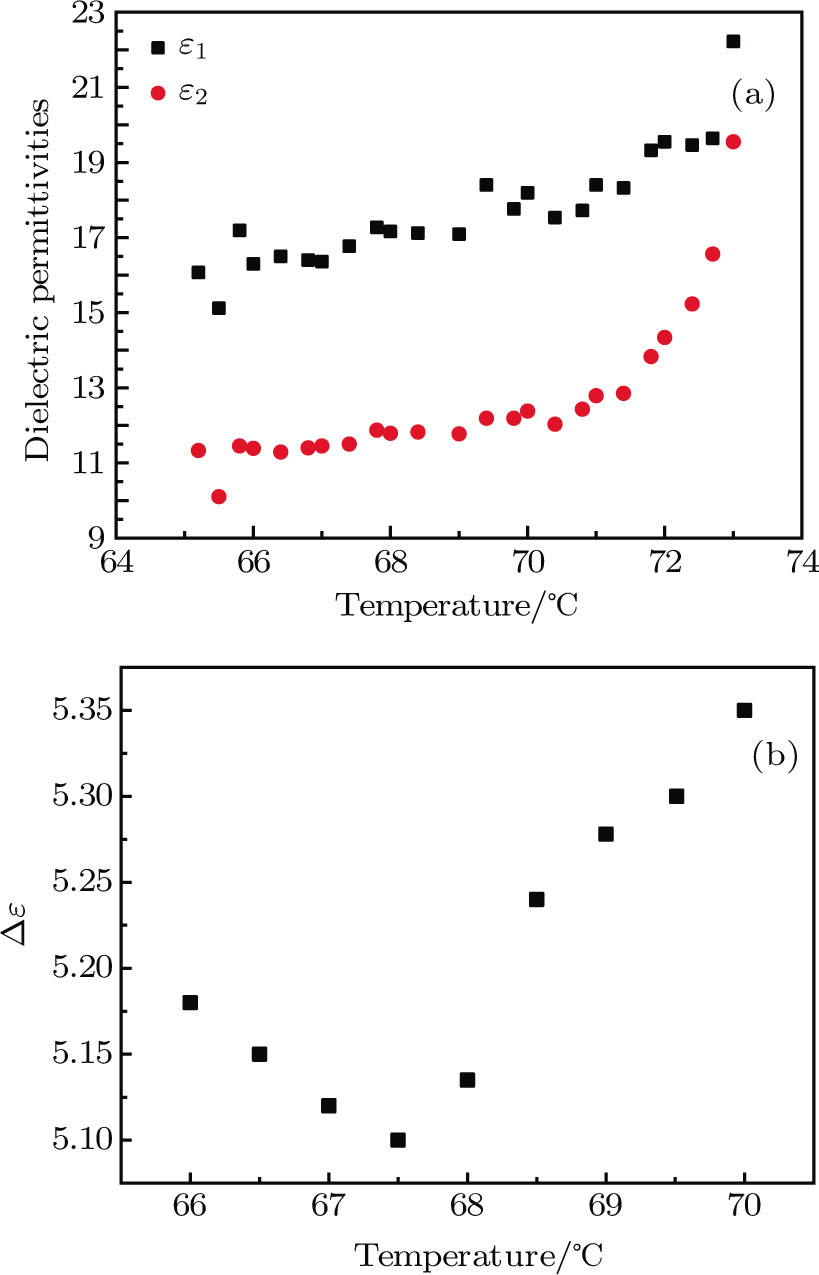
(color online) (a) Representative curve of the relative dielectric constants εr in the SmCunwound* phase in red and SmCα* in black. (b) Representative curve of Δε=ε1−ε2 in the range of temperature [66 °C, 7 °C].