Reconstruction of dynamic structures of experimental setups based on measurable experimental data only
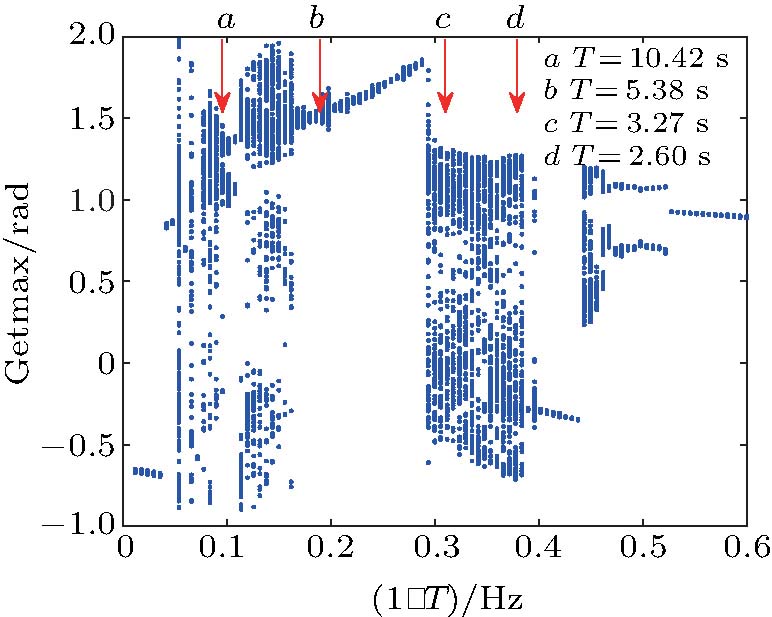
(color online) Bifurcation diagram of the experimental setup in Fig.
Reconstruction of dynamic structures of experimental setups based on measurable experimental data only |
|
(color online) Bifurcation diagram of the experimental setup in Fig. |
| |