|
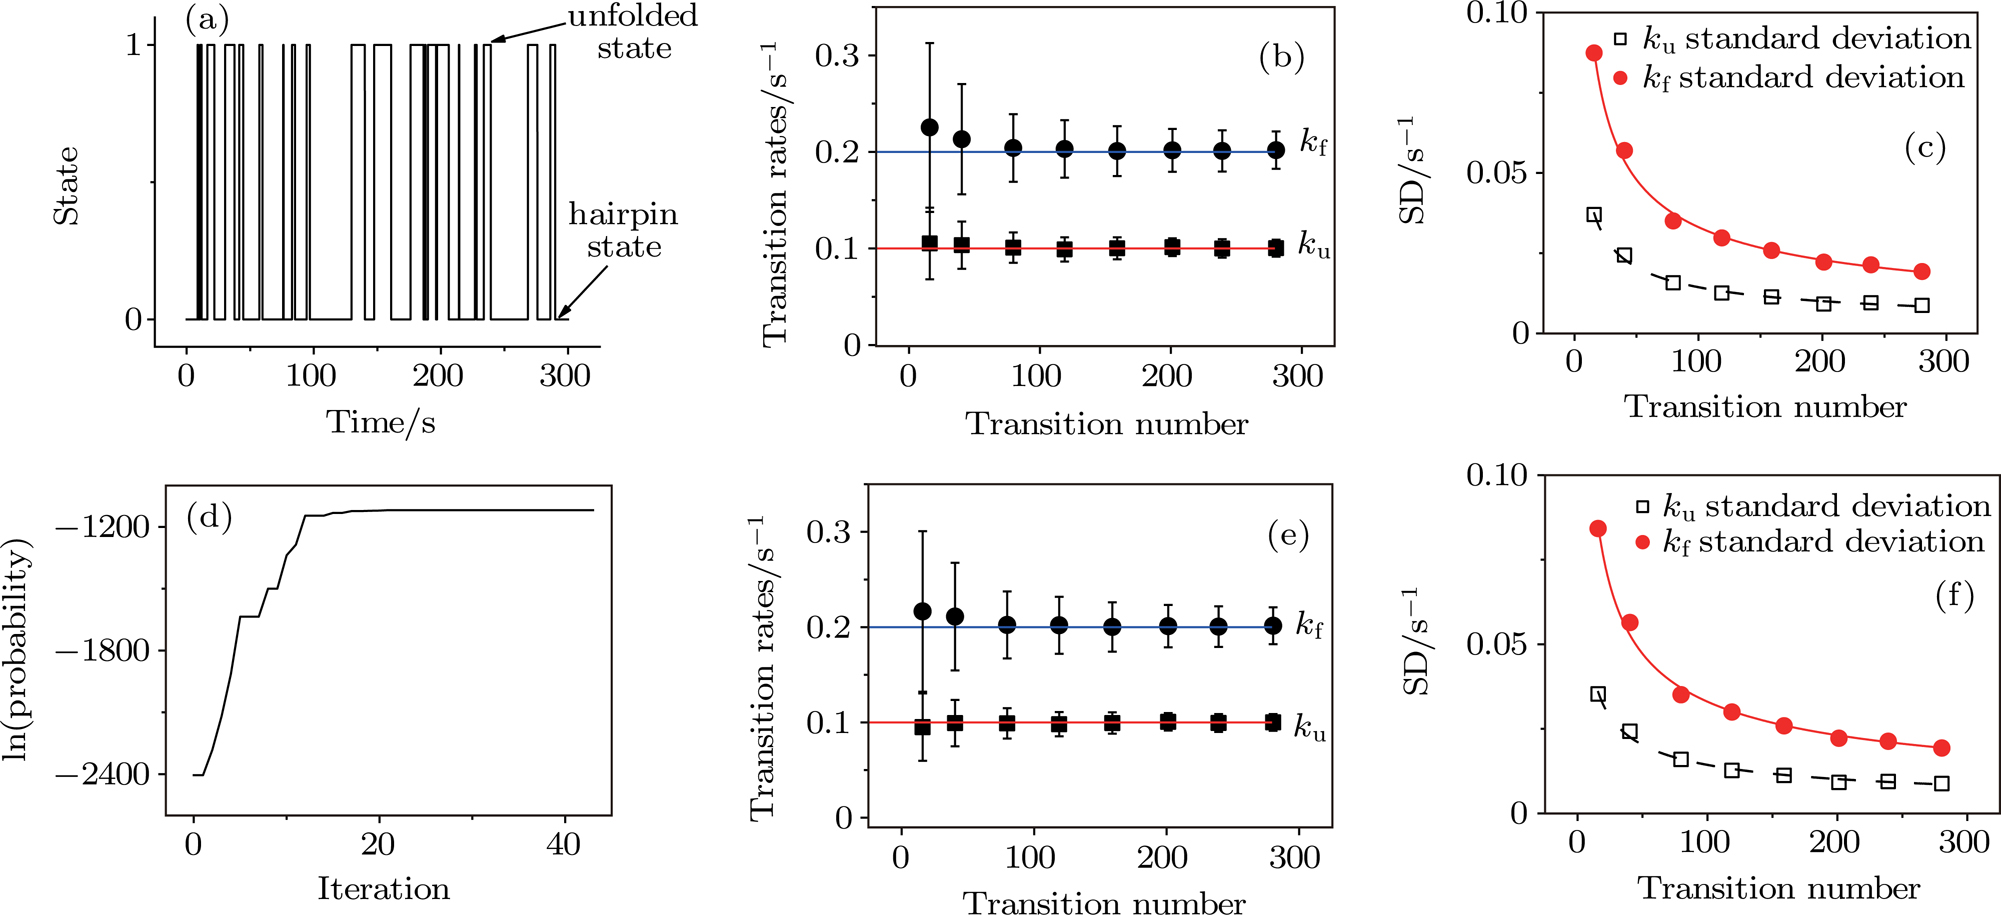
(color online) The optimization algorithm applies to simulation of simple two-state transitions. (a) State time trace obtained by Monte Carlo simulation with parameters
 and
and
 . (b) Folding and unfolding rates obtained by the traditional mean dwell time method are shown as functions of the average transition number from simulations of different time lengths. The error bar shows the standard deviation of results from 100 simulations of the same time length. With increasing simulation time, the transition number increases, and the results converge to the correct values (blue and red horizontal lines). (c) Standard deviations of
 and
and
 as functions of the average transition number can be fitted by equation
 with coefficients:
 :
:
 ,
,
 :
:
 . (d) Logarithm of probability converges to a maximal value in the optimization process with initial values of
 and
and
 . (e) Folding and unfolding rates obtained from the probability optimization method are similar to the results in panel (b). (f) Standard deviations of results from the optimization method can also be fitted by equation
 with coefficients:
 for
for
 and
and
 for
for
 .
.
|


