A network of conformational transitions in an unfolding process of HP-35 revealed by high-temperature MD simulation and a Markov state model
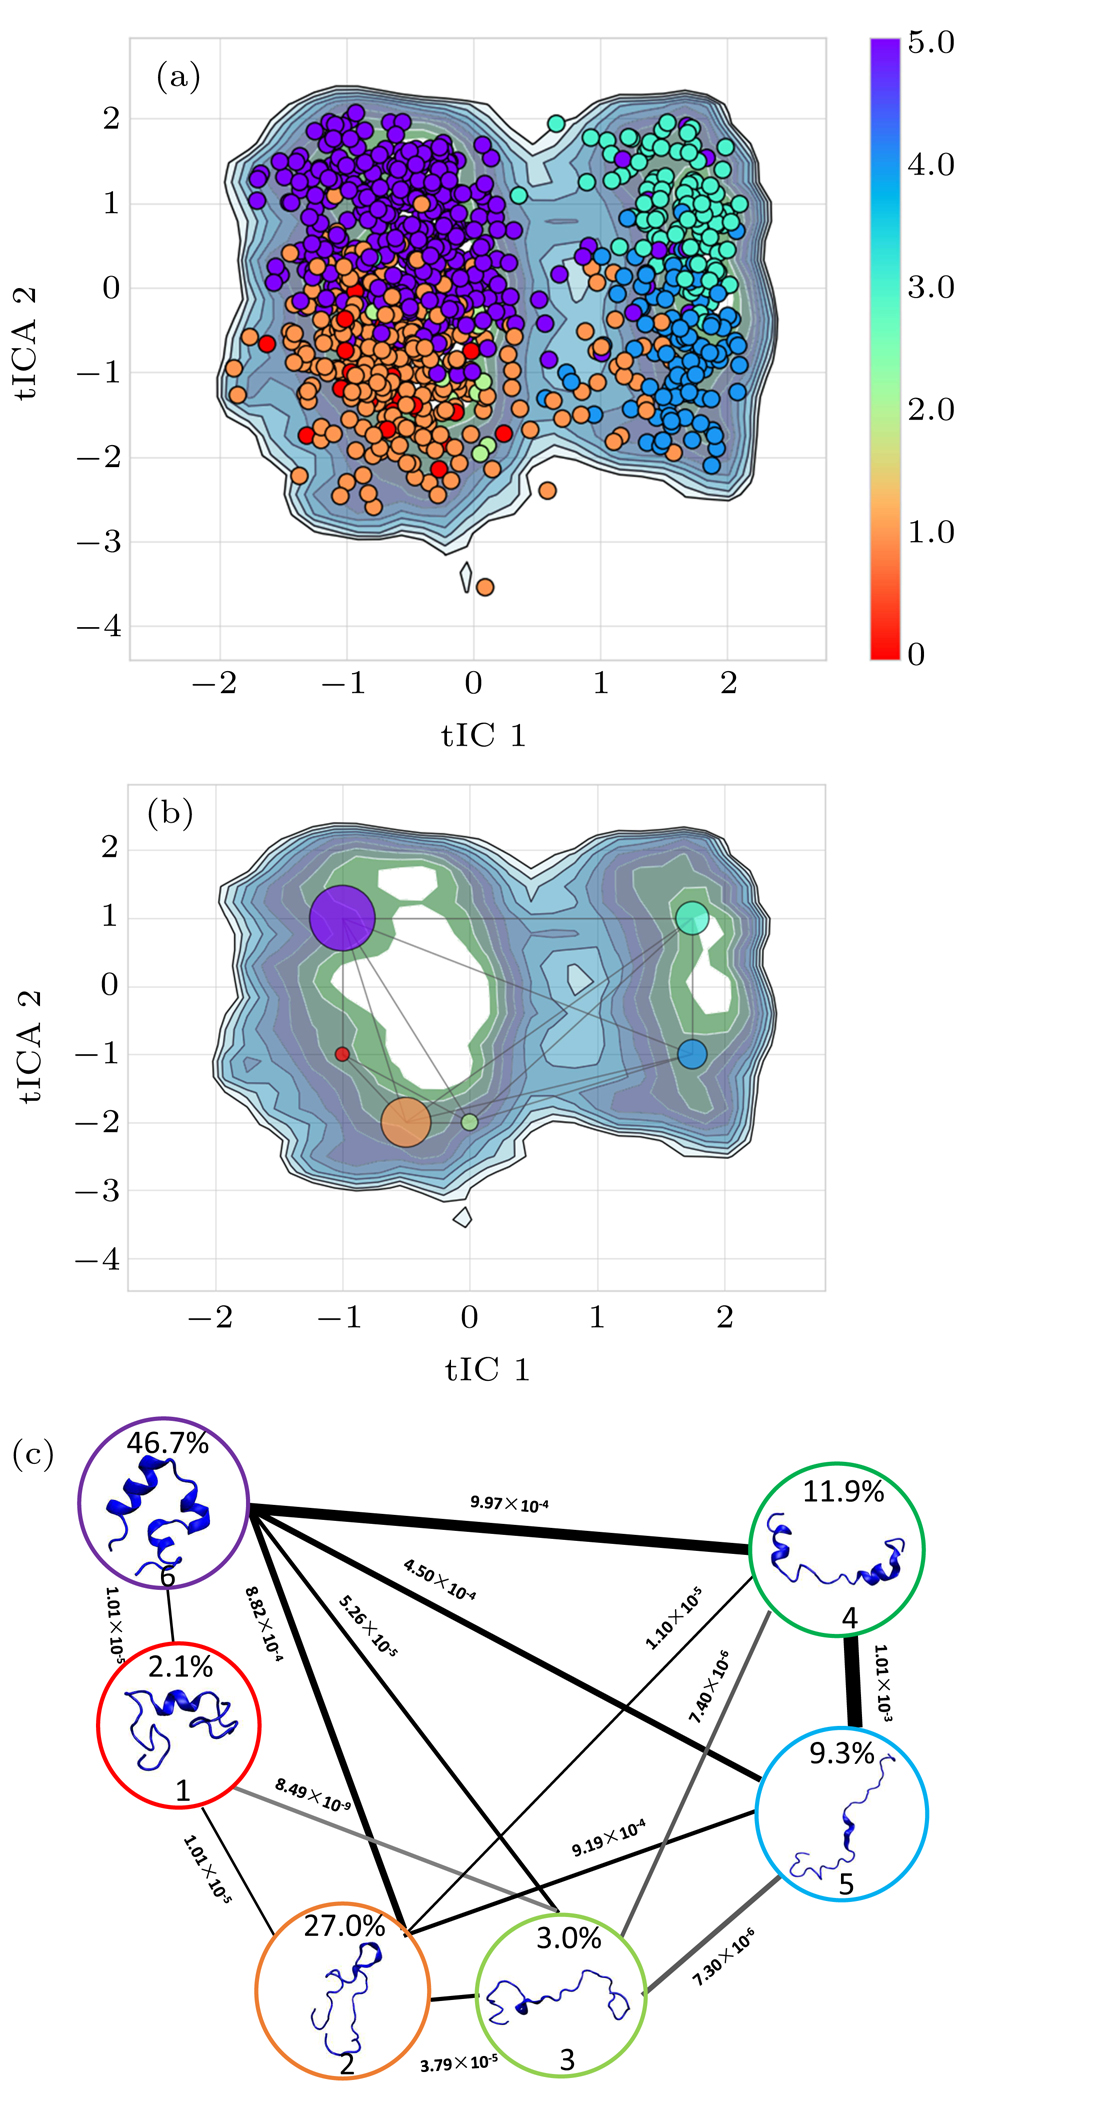
(color online) MSM free energy map and high-flux pathway built from our unfolding simulation of HP-35. (a) The 1000-state microstate model, (b) the six state macrostate model extracted from the microstate model, and (c) the relative population of each macrostate and the net probability flux between each macrostate contributing to the transition from the fully extended state (the state 5) to folded state (the states 6). In panel (a), the circles represent the microstates and are colored according to their membership in the macrostate model. In panel (b), the circles represent the centers of the macrostates, with their sizes indicating the relative populations of the macrostates. In panels (b) and (c), the connecting lines between these circles mean the transitions between the macrostates, with the bold ones corresponding to the high-flux pathway from the fully extended state to the folded state. The free energy map is both shown in panels (a) and (b) as a contour plot.