Electronic states and spin-filter effect in three-dimensional topological insulator Bi2Se3 nanoribbons
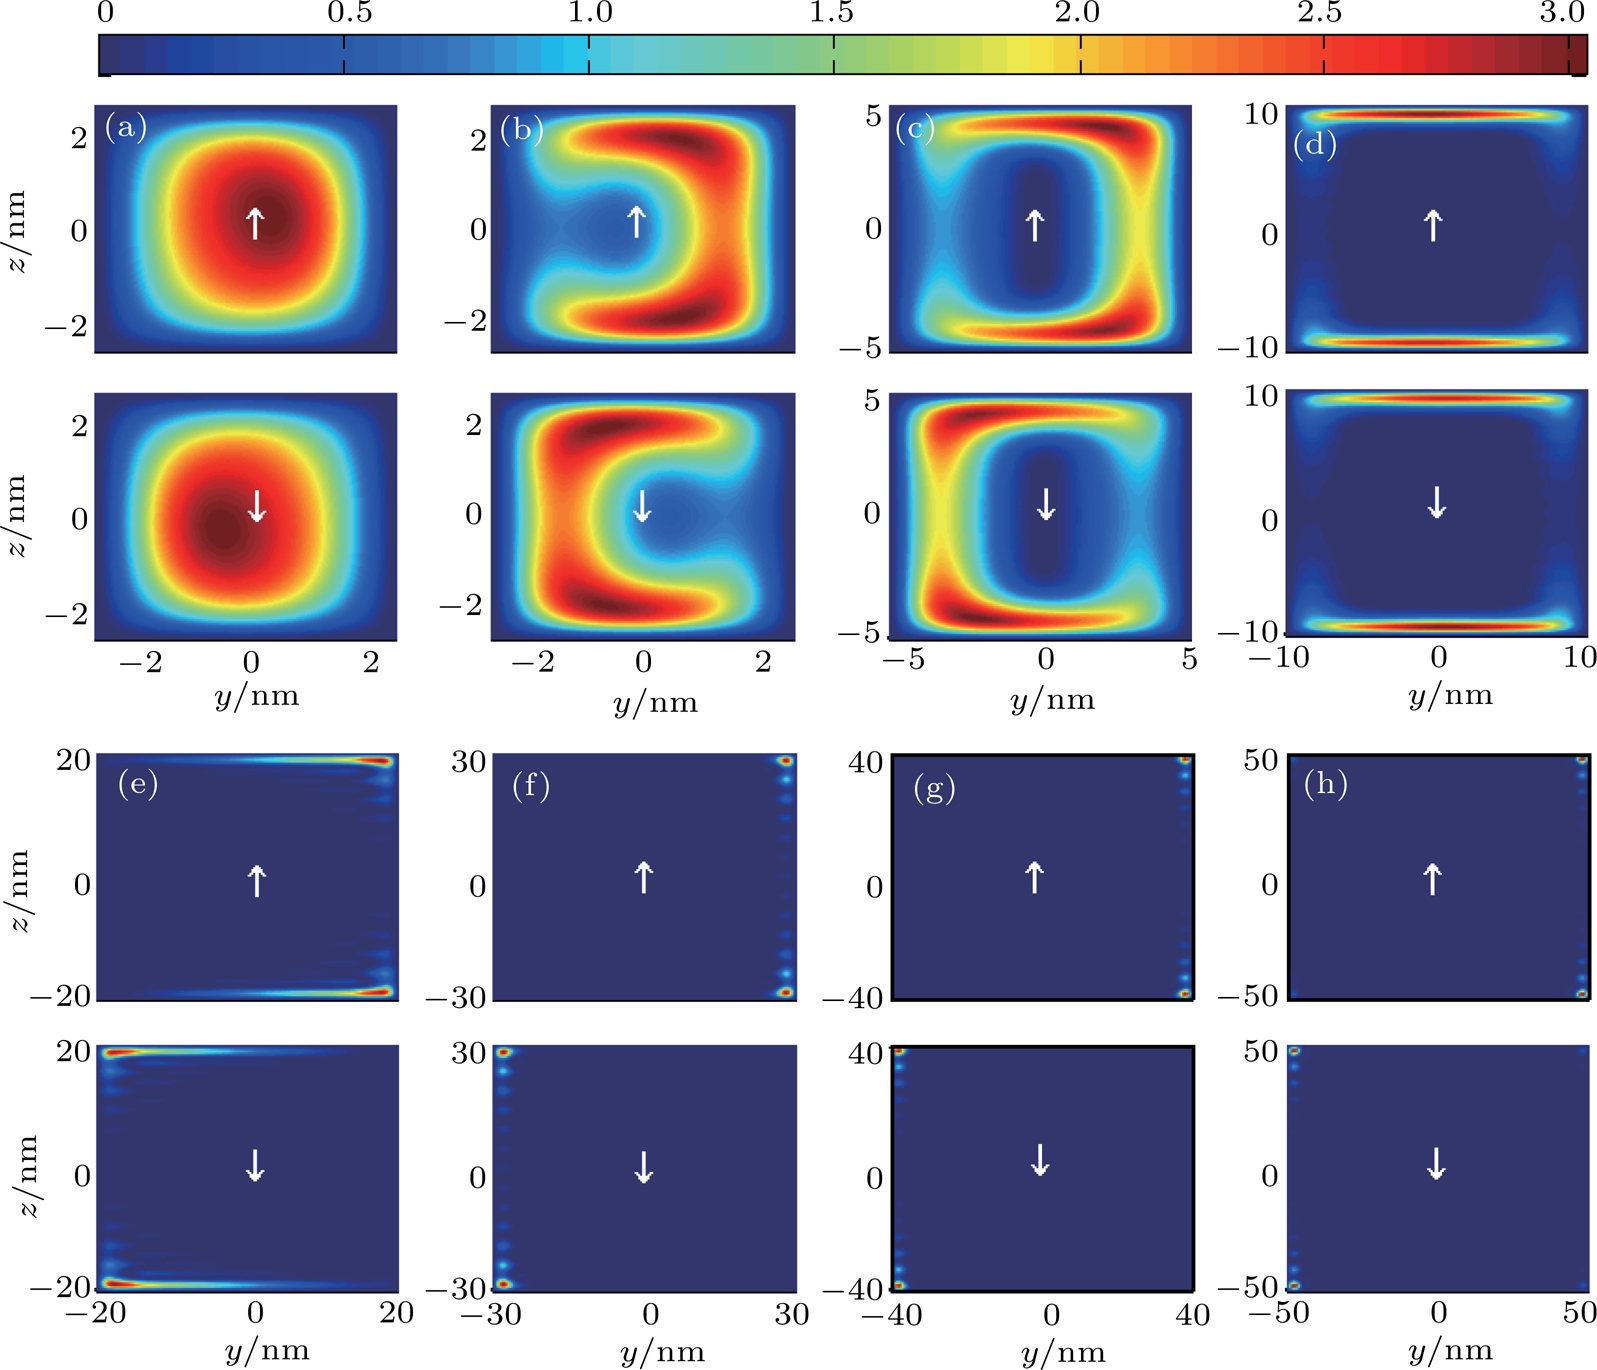
(color online) Contour plot of the density distributions 


Electronic states and spin-filter effect in three-dimensional topological insulator Bi2Se3 nanoribbons |
|
(color online) Contour plot of the density distributions |
 |