Transport properties of mixing conduction in CaF2 nanocrystals under high pressure
Hu Ting-Jing1, Cui Xiao-Yan1, †, Wang Jing-Shu1, Zhang Jun-Kai1, Li Xue-Fei1, Yang Jing-Hai1, Gao Chun-Xiao2, ‡
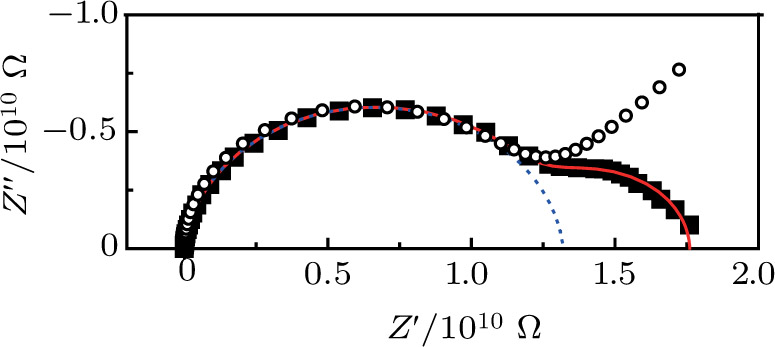
(color online) The – plot of impedance spectra at 1.76 GPa. The solid square is the experimental result. The hollow circle is the result with only F− ions conduction. The continuous line is the simulated spectrum. R1 and R2 are the intercepts of the Nyquist plot on the X axis.