Comparison of band structure and superconductivity in FeSe0.5Te0.5 and FeS
Yang Yang1, Feng Shi-Quan1, Xiang Yuan-Yuan2, Lu Hong-Yan3, Wang Wan-Sheng4, †
       

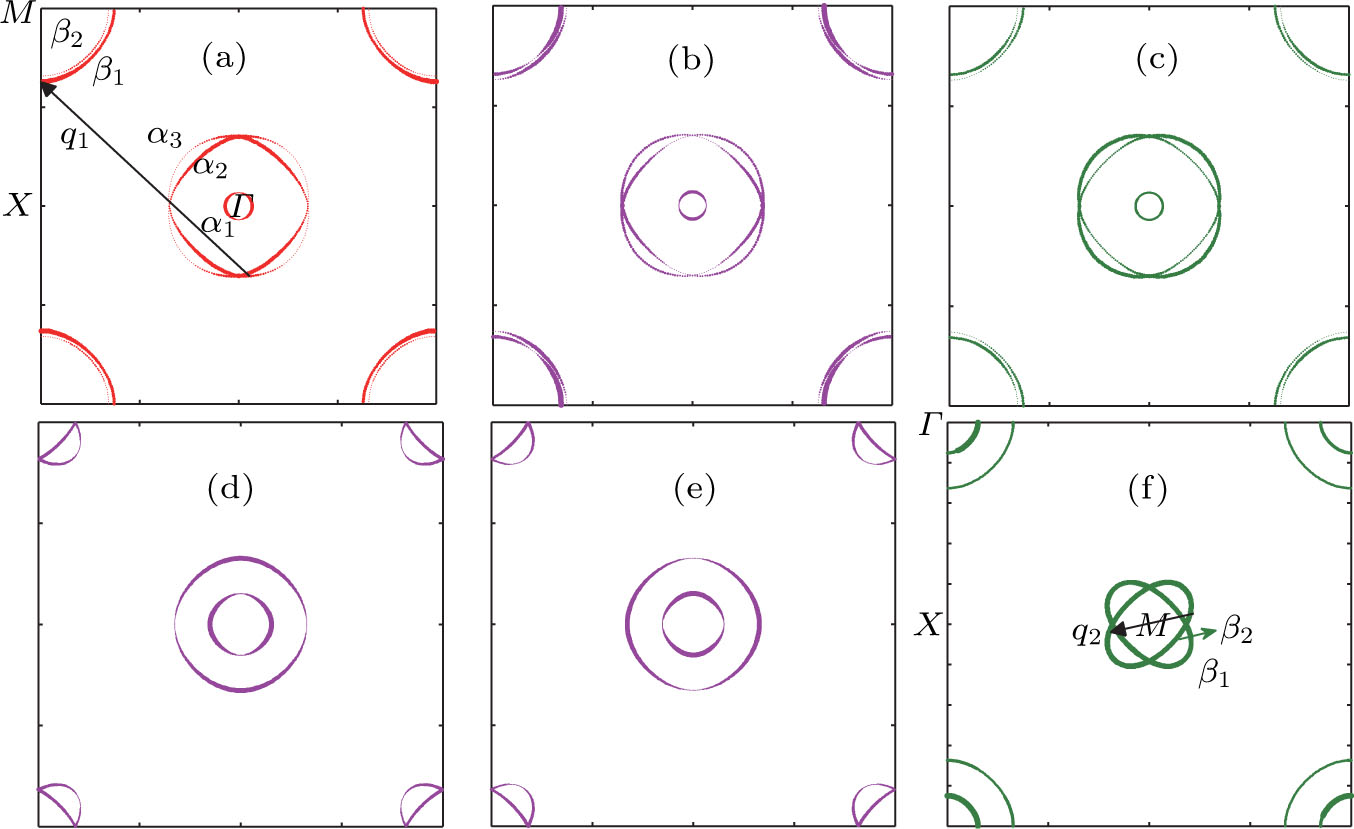
(color online) Fermi surface sheets of FeSe0.5Te0.5 (top) and FeS (bottom) in the 2Fe unit cell. The width of each Fermi surfaces line is proportional to its spectral weights in dXZ, dYZ, and components, respectively. The hole pockets around are denoted by α1, α2, and α3 from the inside out. The electron pockets are denoted by β1 and β2, respectively. The α1 is absent for FeS. The arrows in panels (a) and (f) denote the possible dominant scattering vectors for FeSe0.5Te0.5 and for FeS, respectively.