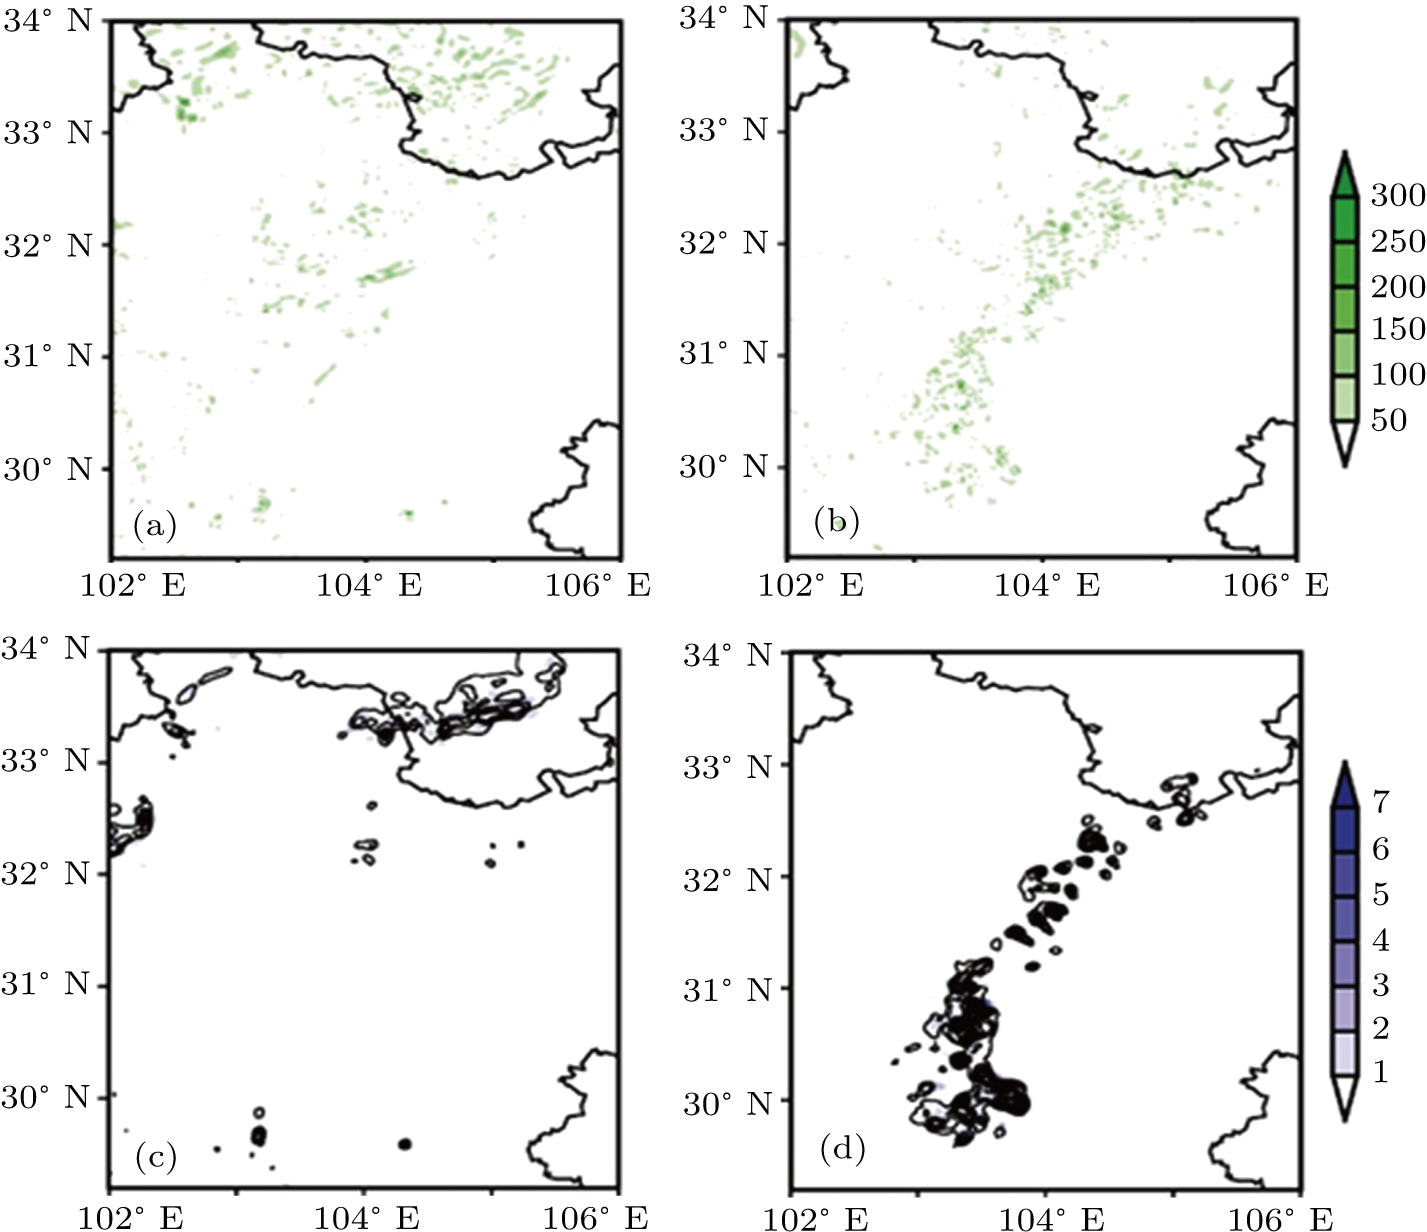
Image of local energy anomaly during a heavy rainfall event
(a) and (b) The horizontal distributions of absolute total energy anomaly (shaded, kg·m−1·s−2), (c)–(d) along with the associated precipitation (contour, mm) and vertical velocity (with the value > 1 m·s−1 shaded) at valley 1 ((a) and (c)) and peak 1 ((b) and (d)) times.
