Nano-infrared imaging of localized plasmons in graphene nano-resonators
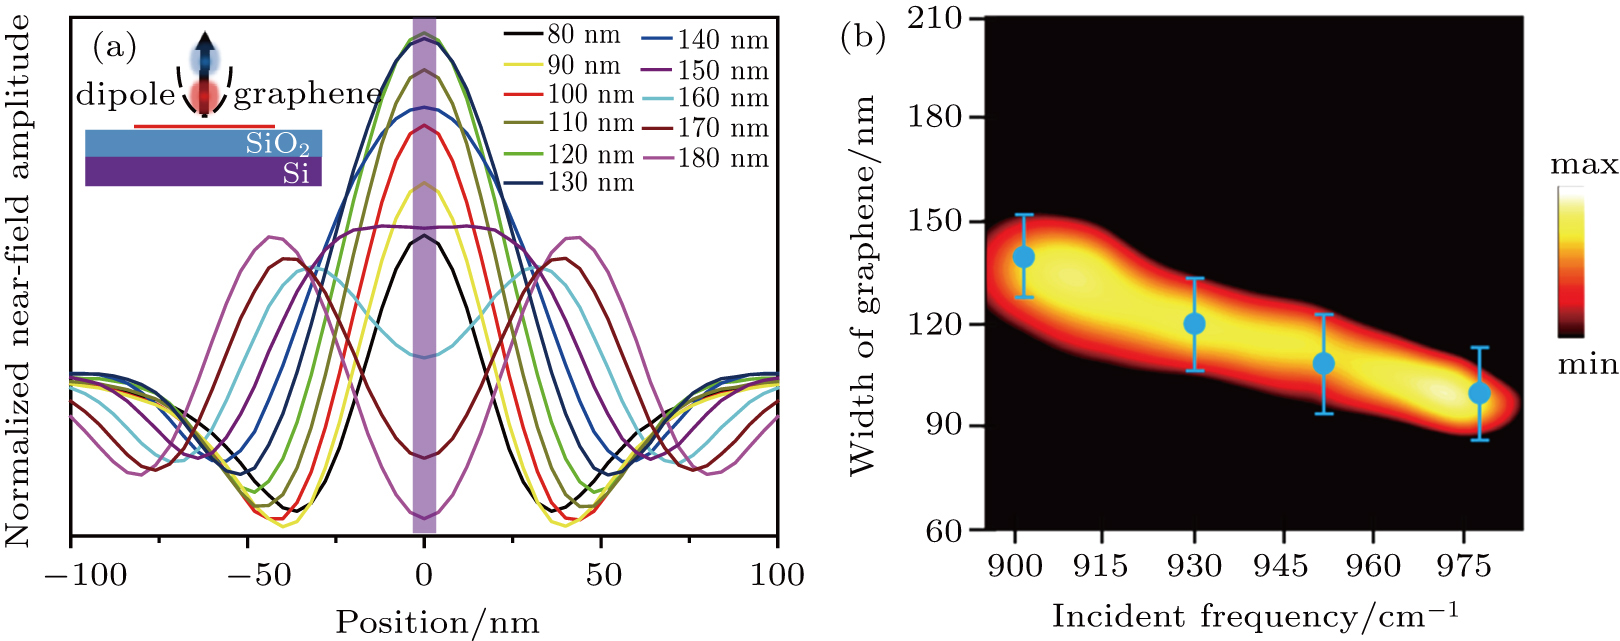
(color online) Corresponding width of graphene for cavity resonance mode. (a) The calculated near-field amplitude in graphene resonator with different widths under the incident frequency of 930 cm−1. The schematic of simulation model is shown in inset. We record the amplitude in the center of graphene (shown as purple area). (b) Numerically simulated amplitude in the graphene center for different widths and incident frequencies (background color). The discrete dots show the experimental WGra for cavity modes extracted from Fig.
