Measurement of iron characteristics under ramp compression
Wei H G1, 2, 3, Brambrink E2, 3, †, Amadou N2, 3, 7, Benuzzi-Mounaix A2, 3, Ravasio A2, 3, Morard G4, Guyot F4, Rességuier T de5, Ozaki N6, Miyanishi K6, Zhao G1, ‡, Koenig M2, 3, ¶
Key Laboratory of Optical Astronomy, National Astronomical Observatories, Chinese Academy of Sciences, Beijing 100012, China
LULI-CNRS, Ecole Polytechnique, CEA, Université Paris-Saclay, F-91128 Palaiseau cedex, France
Sorbonne Universités, UPMC Univ Paris 06, CNRS, laboratoire d’utilisation des lasers intenses (LULI), place Jussieu, 75252 Paris cedex 05, France
Institut de Minéralogie, de Physique des Matériaux, et de Cosmochimie (IMPMC), Sorbonne Universités -UPMC, UMR CNRS 7590, Muséum National d’Histoire Naturelle, IRD UMR 206, F-75005 Paris, France
Institut Pprime, CNRS, ENSMA, Univ. Poitiers, 1 avenue Clément Ader, Futuroscope Cedex, 86961 France
Graduate School of Engineering, Osaka University, Suita, Osaka, 565–0871 Japan
Département de Physique, UniversitéAbdou Moumouni de Niamey, BP. 10662 Niamey, Niger


† Corresponding author. E-mail: erik.brambrink@polytechnique.edu gzhao@bao.ac.cn michel.koenig@polytechnique.edu

Project supported by the National Basic Research Program of China (Grant No. 2013CBA01503) and the National Natural Science Foundation of China (GrantNo. 11103040).

Abstract

Laser-driven ramp compression was used to investigate iron characteristics along the isentropic path. The iterative Lagrangian analysis method was employed to analyze the free surface velocity profiles in iron stepped target measured with two VISARs. The onset stress for the α to ε phase transformation was determined from the sudden change in the sound velocity and was found over-pressurized compared to the static and shock results. The derived stress (26 GPa) and strain rate (up to 108 s−1) are consistent with our previous experimental results. The stress–density relations were compared with those from previous ramp experiments and good agreements were found, which experimentally confirms the simulations, showing that iterative Lagrangian analysis can be applied to the ramp-compression data with weak shock.

1. Introduction

During the last two decades, several planets were discovered around some stars outside the solar system; mass and radius were the main collected information. Deducing planet compositions and internal structure from the mass–radius relation is very often the only possibility to study the physical properties of these extrasolar planets, but this method depends greatly on the equation of state of a planet’s constituent materials.[1] Thus properties of matter at pressures up to 70 Mbar and temperatures up to 20000 K are essential to determine the formation process and internal structure of such planets,[2] of which iron is one of the most important materials and thought to be the main composition element in the core.[3] Over recent decades, the study of matter under extreme conditions has been extended greatly, in both pressure and strain rate, with rapid development of the large pulse power facilities, such as Z-pinch[4] and large laser facility.[5,6] New developments in static compression methods have also raised the limit of available pressure. For example, the highest pressure for metal osmium can reach 750 GPa with conventional and double-stage diamond anvil cells.[7] Also, ramp compression methods have been used to compress matter to pressure and temperature conditions not available with former shock methods and study matter under variable strain rates. Ramp compression with laser was first demonstrated by Edwards et al. in 2004,[8] where laser energy was converted to expanding plasma to load ramp wave on the target. Since then, study of the properties of materials under isentropic conditions, such as the equation of state, the phase transformation, and the elastic response, has been carried out widely.[913]

In this context, the dynamics of phase transition at high strain rates is particularly interesting. The iron body-centered-cubic [bcc] phase to hexagonal-closed packed [hcp] phase transformation was first discovered in 1956[14] and this phenomenon was studied afterwards both in static and shock experiments.[1517] Recently, Smith et al.[18] investigated iron with ramp compression methods on laser facilities and the Sandia Z-machine. In their work, the strain rate reached 108 s−1. By combining their experimental results and previous experimental data, they found a rapid increase in the onset pressure of phase transition when the strain rates are higher than 106 s−1. Laser-driven ramp compression with the compression rate of about 107 s−1 was reported by Amadou et al.[19,20] and explained the pressure overshoot in the context of phase nucleation and growth theory with an isokinetic strain rate regime. Laser-driven isentropic compression is trying to reach the highest pressure with the laser facility under its available parameters, such as energy and pulse width. The key challenge is to avoid the shock formation during compression process, while shock is thermodynamically inevitable when the high pressure sound waves catch up with the low pressure sound waves for a target of infinite thickness. Thus experiments must be carefully designed to make this “catch up” happen on the rear surface of the target. Since the sound wave velocities at different pressures are not exactly known, and the laser intensity cannot be arbitrary changed, it is difficult to achieve the isentropic compression with direct laser-driven method. Generally, ramp compression data at these high rates are relatively rare.

In this paper, laser-driven ramp compression is employed to study iron under isentropic conditions. In earlier ramp compression experiments, laser energy was usually converted into x-ray Planck radiation by irradiating a hohlraum,[21] or the expanding plasma of a plastic reservoir was used to achieve ramp compression.[22] In our experiment, we have chosen a more efficient way, irradiating the sample directly with a temporally shaped laser pulse.[23] A signature of the α-phase to ε-phase transition is observed at 26 GPa. This pressure is much higher than that observed in static and shock experiments (13 GPa).[14,15] The compressive strain rates in our experiment are up to 108 s−1. The present results are consistent with our previous work, where these over pressurizations were observed and well explained using the phase nucleation and growth theory with an isokinetic regime for the strain rates ranging from 3 × 10⁷ s−1 to 9 × 10⁷ s−1.[20] Comparison of stress–density relations with other ramp experiments is made, and good agreements are found. The layout of the article is as follows. The experiment setup is described in Section 2. The experimental results and discussion are then given in Section 3. The summary and conclusions are present in Section 4.

2. Experimental setup

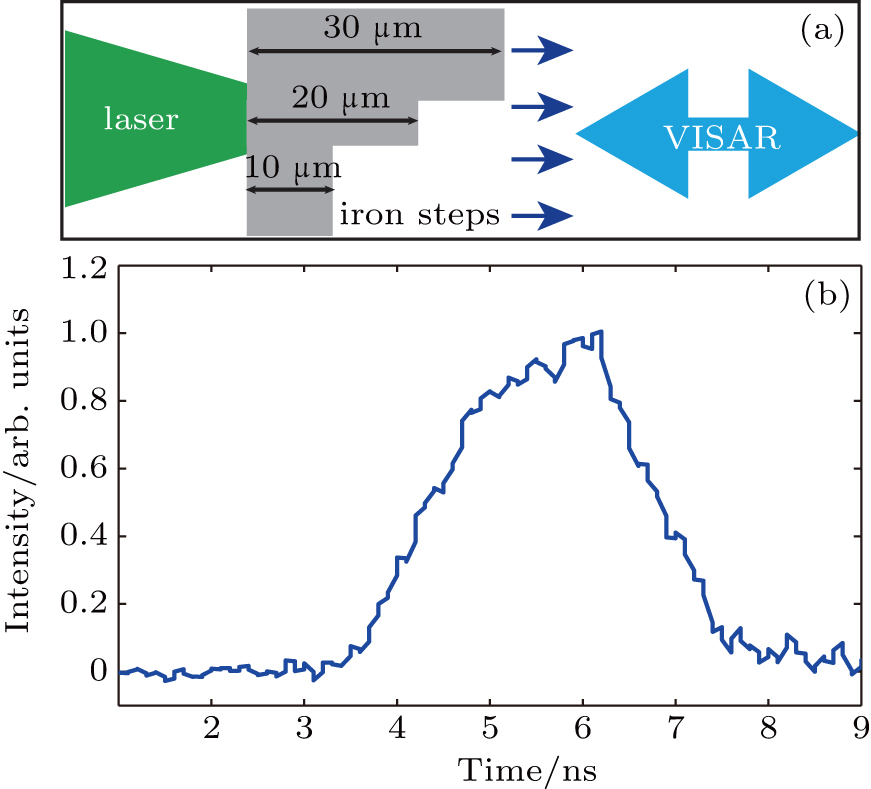
The experiment was performed at the LULI2000 laser facility, which can deliver a total energy of 400 J with pulse duration of up to 5 ns at wavelength of 532 nm. To achieve the ramp compression, shock must be avoided. Thus the laser pulse intensity has to be adjusted to increase smoothly.[24] In our experiment, the laser pulse shape was optimized to an exponential shape instead of linear shape based on the theoretical model.[25,26] This is similar to our previous ramp experiments.[19,20,27] A 1 mm diameter flat intensity profile of laser was obtained by using the hybrid phase plate (HPP). Targets were free standing iron foils with steps of 10/20/30 μm thicknesses. The iron was a polycrystalline rolled foil acquired from Goodfellow. The schematic diagram of the experiment setup and the measured laser pulse shape are shown in Fig. 1.

Fig. 1. (color online) (a) The schematic diagram of experimental setup and (b) the measured laser pulse shape. The laser beam was directly ablating the iron stepped target with a flat intensity spot of a diameter of 1 mm. Two VISARs with different velocity sensitivities were used to record the velocity profile of the rear surface of iron.

To measure the rear surface velocity of the iron target, two velocity interferometer systems for any reflector (VISARs) were used to eliminate the ambiguity in case of a fringe jump. Etalons with different thickness were used to provide different velocity sensitivities for the two VISARs. The velocity-per-fringe (VPF) constants of the two VISARs are 0.992 km/s and 1.653 km/s. The temporal and spatial resolutions are 100 ps and 10 μm, respectively. The velocity profiles from the two VISARs agree well. The VISAR uses a probe laser beam delivering 1 mJ with 8 ns full width half maximum pulse length at a wavelength of 532 nm. It is independent of the drive laser and can have a variable delay relative to the drive laser. Furthermore, a streaked optical pyrometer (SOP) was used to record thermal emission from the rear surface of the iron target. As expected for isentropic compression, the temperatures were below the detection threshold of the diagnostic equipment (approximately 4000 K).

3. Experimental results and discussion

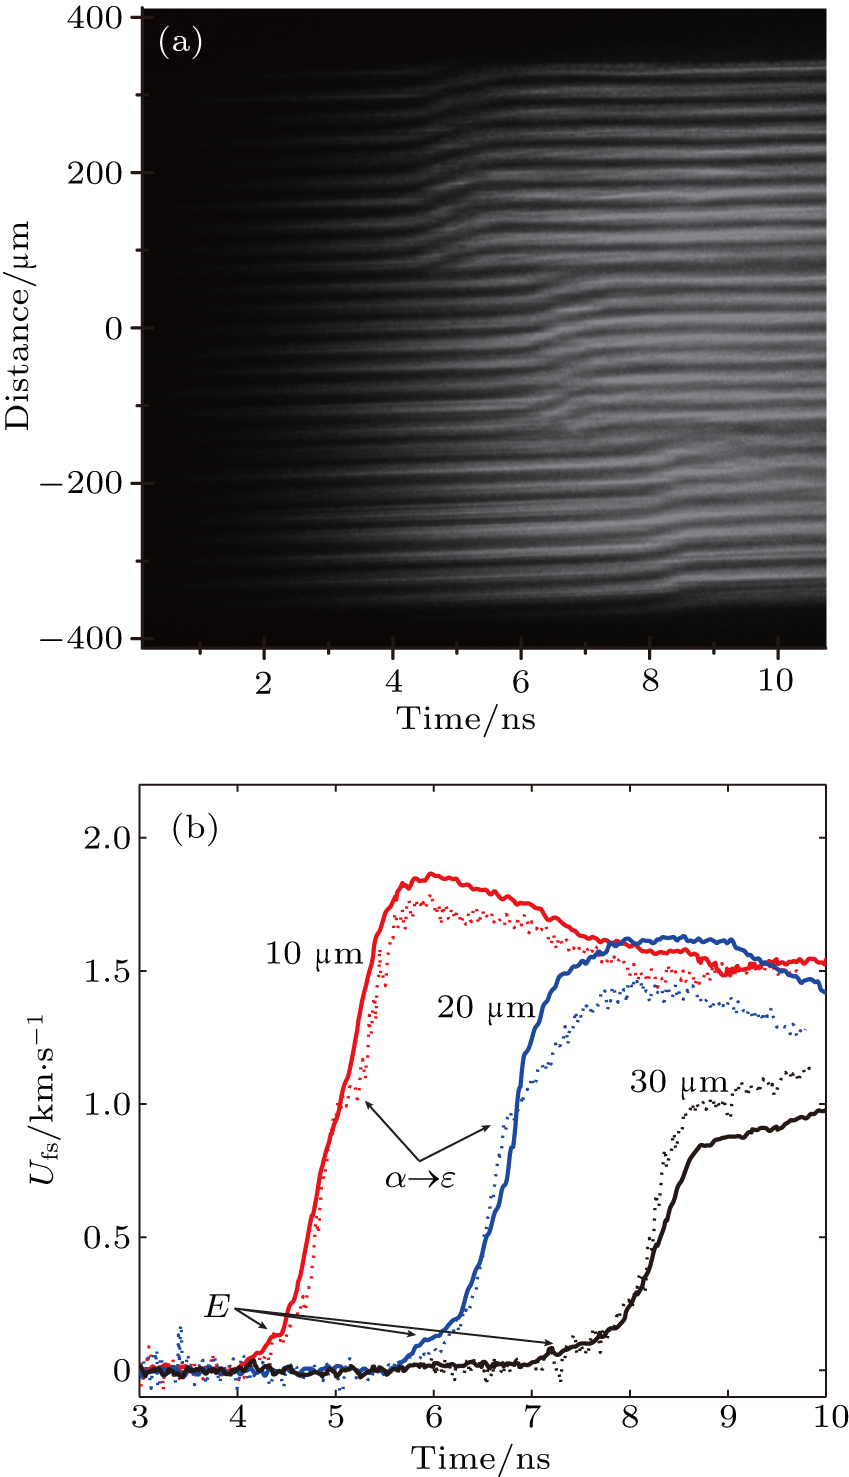
The raw image and velocity profiles of the iron’s rear surface measured with two VISARs are shown in Fig. 2. In Fig. 2(a), the fringes move smoothly and continuously along the time and no discontinuities are found, which indicates that the compression is isentropic and no shock forms. The velocity profiles for the iron 10/20/30 μm steps are shown in Fig. 2(b) and VISAR results with different velocity sensitivities agree well with each other. The typical three-wave structure, one elastic wave and two subsequent plastic waves, is observed in the velocity profiles. At the foot of the velocity profile shown in Fig. 2(b), a so-called elastic precursor, labeled “E”, appears at a free surface velocity of about 0.12 km/s, which is caused by a decrease from the longitudinal elastic wave speed to the bulk sound velocity above the onset of plastic deformation. This elastic precursor decreases and gets longer with increasing step size due to the plastic flow and subsequent stress relaxation behind the wave front pushing the elastic-plastic transition wave amplitude toward an asymptotic equilibrium value.[28] While for the velocity profile with the VPF of 1.653 km/s, no signature of the iron αε transition is clearly observable; a small velocity plateau can be distinguished in the 10 μm iron step velocity profile (with a VPF of 0.992 km/s) at approximately 1.2 km/s, which indicates the onset of the transition from α-phase to ε-phase. This plateau is also vaguely observed in the 20 μm iron step profile at approximately 1.0 km/s. The velocity of the plateau decays with the wave propagation distance through the target, consistent with data reported by Smith et al.[18] There are many oscillations in the velocity profiles with velocity sensitivity of 0.992 km/s, which are due to the relatively high velocity sensitivity. It is quite difficult to interpolate these data when calculating the sound velocity and doing the characteristic correction. Besides, smoothing these data may lose velocity information, and it is hard to define its effect on the final stress–density relation. However, velocity profiles with low velocity sensitivity (1.653 km/s), i.e., the solid lines in Fig. 2(b), are quite smooth. Since these two velocity profiles are in good agreement with error-bar taken into account, we use velocity profiles with low sensitivity to investigate the iron equation of state under ramp compression in the following.

Fig. 2. (color online) (a) The sample of the raw VISAR image. (b) The velocity profile of the stepped iron rear surface. The solid lines are velocity profiles with a VPF of 1.653 km/s and the dotted lines are profiles with a VPF of 0.992 km/s for iron 10/20/30 μm steps.

The iterative Lagrangian analysis,[29,30] that is, Lagrangian sound speed analysis combined with the iterative characteristic corrected method, is employed to analyze the experimental data. In Lagrangian analysis, a simple wave is assumed and the sound velocity is calculated by CL(u) = (Z2Z1) / (T2(u) − T1(u)), where Z2 and Z1 are the thicknesses of two steps, respectively, T2(u) and T1(u) are the arrival time with a particle velocity u at the two step rear surfaces. Then the stress and the volume can be obtained by integrating the following equations: where σ is the stress, ρ0 is the initial density of iron, u is the particle velocity, and V is the volume. The characteristic analysis method, which accounts for the wave interactions due to the limited target size, is used to get the in-situ particle velocity. After these characteristic corrections, the Lagrangian sound speed CL(u) is shown in Fig. 3 as a function of the rear surface velocity, where the uncertainties of the sound velocity are calculated using the same method as Smith et al.,[18] namely, the uncertainties in the slope of linear least-squares to the characteristic lines in Lagrangian coordinates. The sound speeds calculated by different steps are shown. The decrease of the sound speed at the free surface velocity (Ufs) of about 0.1–0.2 km/s indicates the elastic to plastic deformation. This result is consistent with the expectations.[20] In addition, one can observe a clear drop in CL at the Ufs of about 1.2 km/s, which is a sign of the onset of the α-phase to ε-phase transformation. This corresponds to a pressure of 26 ± 3 GPa, comparable with values found in previous ramp experiments (25 GPa at strain rate of 8.7 × 10⁷ s−1).[20]
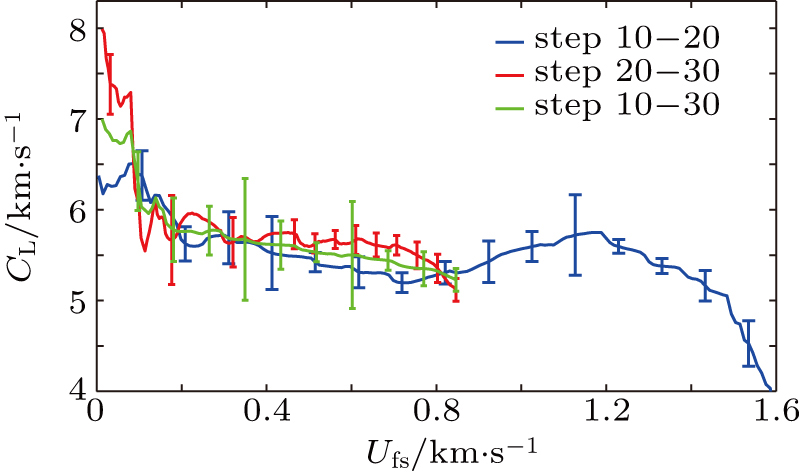
Fig. 3. (color online) Lagrangian sound velocity calculated by different steps as a function of the rear free surface velocity. The error bar shows the uncertainties of the sound velocity.

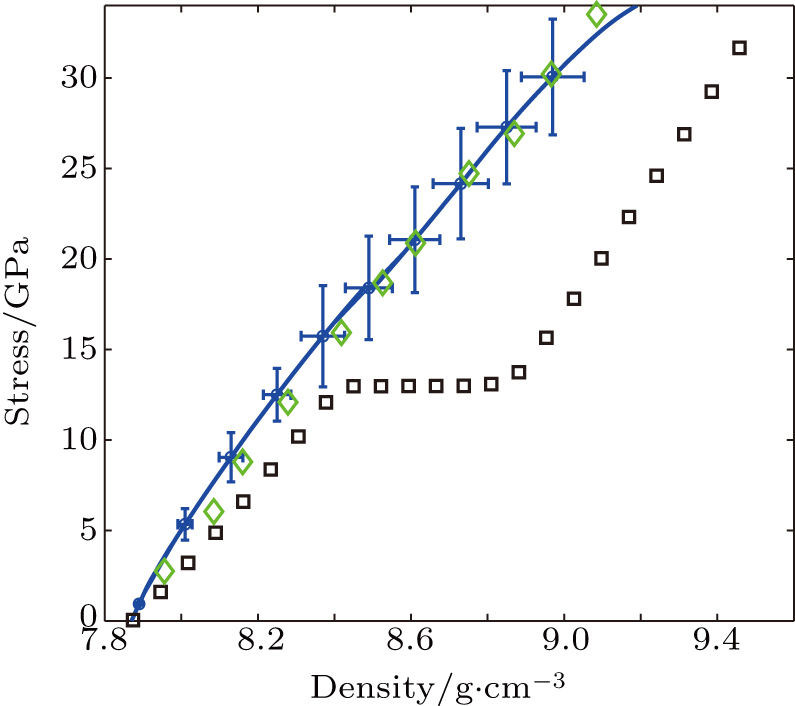
Figure 4 shows the stress–density relations integrated from Eq. (1). The uncertainties of stress and density are directly calculated from the uncertainties of sound velocity and shown in Fig. 4. The results from Omega experiments[21] together with those Hugoniot data from SESAME table 2140[31] are also plotted in Fig. 4. As the SESAME does not treat any phase transition dynamics and represents the static phase diagram, a plateau is observed at about 13 GPa, corresponding to the αε transition under static compression. In contrast, in the high strain rate experiments, our experimental data and those from the Omega shot s58588[21] show a smooth increase in stress as the density increases with no sign of a phase transition. Our experimental results are directly compared with the results from the Omega experiment,[21] where similar analysis was applied, with excellent agreement except a slight deviation at the high stress. This deviation is caused by the shock heating which makes the iron stiffer than pure ramp compression.[30] The iron was pre-compressed by a designed shock and then along the isentropic path in the experiment.[21] This is the first experimental demonstration that the iterative Lagrangian analysis can be used even if shocks are present in ramp compression, which is in consistent with the former simulation results.[30]

Fig. 4. (color online) Stress–density relations calculated from our experiment (blue curves with error bars). Also shown are the stress–density data from SESAME (black squares) and Wang et al. (green diamonds).[21]

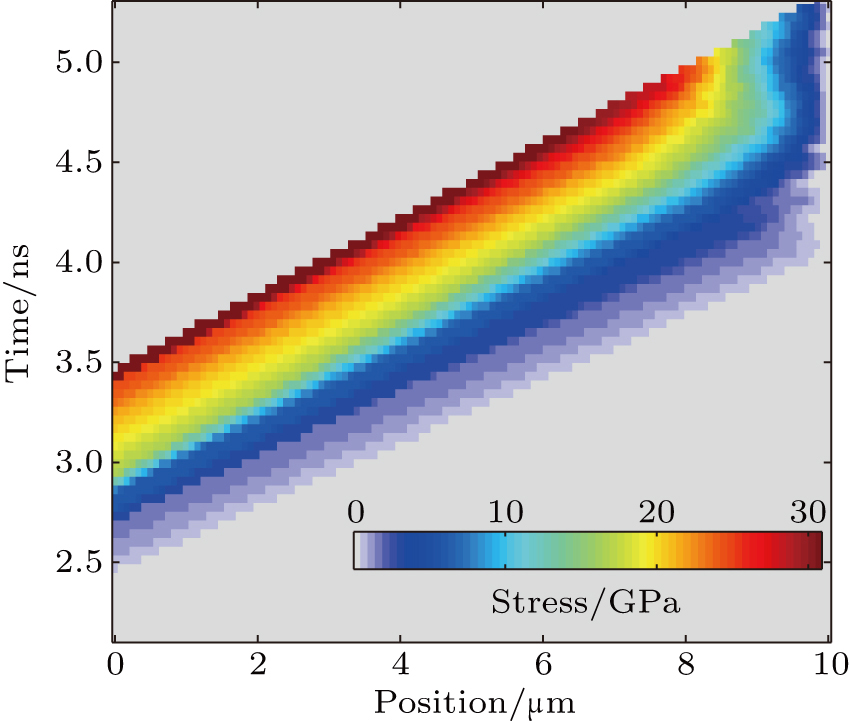
The stress distributions along the time and Lagrangian position in the iron, calculated from the iterative Lagrangian analysis, are shown in Fig. 5. The onset stress of α-phase to ε-phase transition is about 26 GPa (corresponding to sound velocity about 1.2 km/s) in our experiment. This stress is much higher than the equilibrium value (13 GPa) in static or low strain rate experiments.[15,16] This increase in the onset stress, namely, the over-pressurization, can be well explained by an Avrami-type kinetics model based on the phase nucleation and growth theory with a constant characteristic time (isokinetics regime) in a limited strain rate range.[20] While for a much broader range of the strain rates, the transition characteristic time should vary;[18] and for strain rate greater than 106 s−1, Smith et al.[18] reported a sudden variation of the transition pressure overshot with the strain rate attributed to the deformation mechanism changing from thermally activated to phonon drag dislocation motion when compressing at high strain rate. The strain rate for the phase transformation is calculated as , using the stress distribution in Fig. 5. The strain rates at the free surface, where the onset stress (26 GPa) has just arrived and no wave is reflected, are around 1.7 × 10⁸ s−1 for 10 μm iron step and 1.4 × 10⁸ s−1 for 20 μm iron step. In fact, the strain rate could also be directly estimated from the velocity profile: ,[32] which also gives a similar value of 1.0 × 10⁸ s−1 in our experiment. Thus it could be roughly deduced that the strain rate for the stress of 26(±3) GPa is about 1.4 × 10⁸ s−1. Taken this strain rate into Eq. (3) by Smith et al.,[18] we can obtain that the stress for αε phase is 33.6 GPa, which is a little higher than our experimental result. This is not surprising since equation (3) in Smith et al.[18] is obtained over a range of lower strain rates where most are less than 1 × 10⁷ s−1 and only one is greater than 1 × 10⁸ s−1. A new fit to the experimental data presented by Smith et al.,[18] Amadou et al.,[20] and our work is represented by

Fig. 5. (color online) Stress distribution along time and Lagrangian position in the iron target.
4. Summary and conclusion

We have investigated the iron properties under ramp compression by directly irradiating the sample with a profiled laser pulse. The free surface velocity profiles of an iron step target measured by VISAR were analyzed with iterative Lagrangian analysis, and the stress–density relations were determined. Our data is in excellent agreement with other ramp compression experiments. This is the first experiment demonstrating that iterative Lagrangian analysis can be applied even if shock occurs in the ramp compression. Strain rates up to 108 s−1 were achieved in our experiment and the onset stress for αε phase transition was found to be over pressurized, in accordance with our previous experimental results[20] and those from Smith et al.[18] The data presented here together with our previous data[20] are a good supplement to experimental data of strain rates greater than 107 s−1.

Reference
[1] Swift D C Eggert J H Hicks D G Hamel S Caspersen K Schwegler E Collins G W Nettelmann N Ackland G J 2012 Astrophys. J. 744 59
[2] Miguel Y Guillot T Fayon L 2016 Astron. Astrophys. 596 114
[3] Baraffe I Chabrier G Fortney J Sotin C 2014 Protostars and Planets VI Beuther H Klessen R S Dullemond C P Henning T Tucson University of Arizona Press 763
[4] Knudson M D Hanson D L Bailey J E Hall C A Asay J R 2003 Phys. Rev. Lett. 90 035505
[5] Bradley D K Eggert J H Smith R F Prisbrey S T Hicks D G Braun D G Biener J Hamza A V Rudd R E Collins G W 2009 Phys. Rev. Lett. 102 075503
[6] Smith R F Eggert J H Jeanloz R Duffy T S Braun D G Patterson J R Rudd R E Biener J Lazicki A E Hamza A V Wang J Braun T Benedict L X Celliers P M Collins G W 2014 Nature 511 330
[7] Dubrovinsky L Dubrovinskaia N Bykova E Bykov M Prakapenka V Prescher C Glazyrin K Liermann H P Hanfland M Ekholm M Feng Q Pourovskii L V Katsnelson M I Wills J M Abrikosov I A 2015 Nature 525 226
[8] Edwards J Lorenz K T Remington B A Pollaine S Colvin J Braun D Lasinski B F Reisman D McNaney J M Greenough J A Wallace R Louis H Kalantar D 2004 Phys. Rev. Lett. 92 075002
[9] Smith R F Minich R W Rudd R E Eggert J H Bolme C A Brygoo S L Jones A M Collins G W 2012 Phys. Rev. 86 245204
[10] Bradley D K Eggert J H Smith R F Prisbrey S T Hicks D G Braun D G Biener J Hamza A V Rudd R E Collins G W 2009 Phys. Rev. Lett. 102 075503
[11] Bastea M Bastea S Becker R 2009 Appl. Phys. Lett. 95 241911
[12] Smith R F Eggert J H Saculla M D Jankowski A F Bastea M Hicks D G Collins G W 2008 Phys. Rev. Lett. 101 065701
[13] Morard G Bouchet J Valencia D Mazevet S Guyot F 2011 High Energy Density Phys. 7 141
[14] Bancroft D Peterson E L Minshall S 1956 J. Appl. Phys. 27 291
[15] Barker L M Hollenbach R E 1974 J. Appl. Phys. 45 4872
[16] Boettger J C Wallace D C 1997 Phys. Rev. 55 2840
[17] Wang F M Ingalls R 1998 Phys. Rev. 57 5647
[18] Smith R F Eggert J H Swift D C Wang J Duffy T S Braun D G Rudd R E Reisman D B Davis J P Knudson M D Collins G W 2013 J. Appl. Phys. 114 223507
[19] Amadou N Brambrink E Benuzzi-Mounaix A Huser G Guyot F Mazevet S Morard G de Resseguier T Vinci T Myanishi K Ozaki N Kodama R Boehly T Henry O Raffestin D Koenig M 2013 High Energy Density. Phys. 9 243
[20] Amadou N de Resseguier T Brambrink E Vinci T Benuzzi-Mounaix A Huser G Morard G Guyot F Miyanishi K Ozaki N Kodama R Koenig M 2016 Phys. Rev. B. 93 214108
[21] Wang J Smith R F Eggert J H Braun D G Boehly T R Reed P J Celliers P M Jeanloz R Collins G W Duffy T S 2013 J. Appl. Phys. 114 023513
[22] Lorenz K T Edwards M J Jankowski A F Pollaine S M Smith R F Remington B A 2006 High Energy Density. Phys. 2 113
[23] Benuzzi-Mounaix A Koenig M Ravasio A Vinci T Ozaki N Rabec le Gloahec M Loupias B Huser G Henry E Bouquet S Michaut C Hicks D MacKinnon A Patel P Park H S LePape S Boehly T Borghesi M Cecchetti C Notley M Clark R Bandyopadhyay S Atzeni S Schiavi A Aglitskiy Y Faenov A Pikuz T Batani D Dezulian R Tanaka K 2006 Plasma Phys. Control. Fusion 48 347
[24] Swift D C Johnson R P 2005 Phys. Rev. 71 066401
[25] Swift D C Kraus R G Loomis E N Hicks D G McNaney J M Johnson R P 2008 Phys. Rev. 78 066115
[26] Brambrink E Amadou N Benuzzi-Mounaix A Geissel M Harmand M Pelka A Vinci T Koenig M 2015 Contrib. Plasma Phys. 55 67
[27] Amadou N Brambrink E de Resseguier T Manga A O Aboubacar A Borm B Molineri A 2016 Metals 6 320
[28] Taylor J W 1965 J. Appl. Phys. 36 3146
[29] Rothman S D Maw J 2006 J. Phys. IV 134 745
[30] Fratanduono D E Smith R F Braun D G Patterson J R Kraus R G Perry T S Arsenlis A Collins G W Eggert J H 2015 J. Appl. Phys. 117 245903
[31] SESAME The LANL Equation of State Database, Tech. Rep. LA-UR-92-3407 LANL 1992
[32] Smith R F Minich R W Rudd R E Eggert J H Bolme C A Brygoo S L Jones A M Collins G W 2012 Phys. Rev. 86 245204