Indirect pumping bell–bloom magnetometer
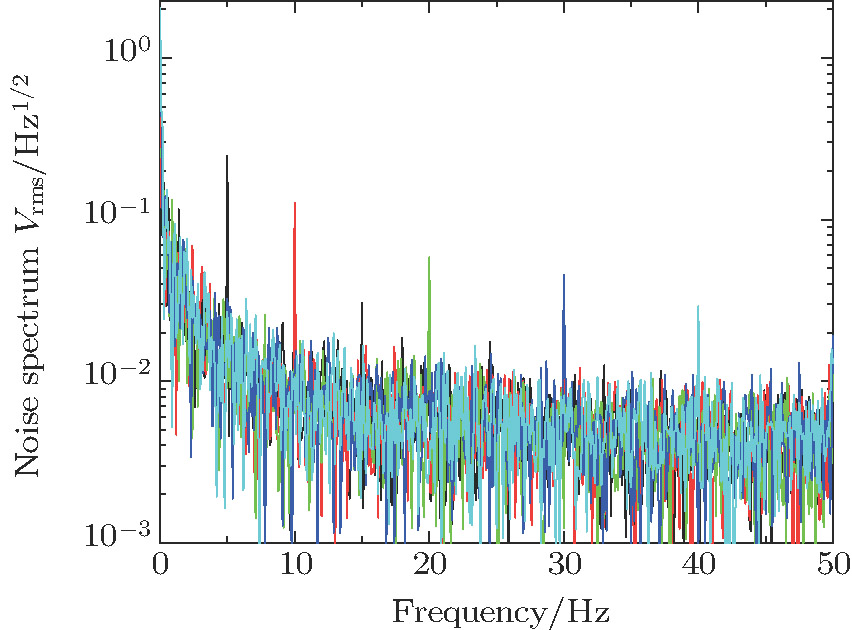
(color online) Power density spectrum (square rooted) of the magnetometer. There are total 5 spectra. Each is taken with a different frequency modulation rate of the calibration signal: 5 (black), 10 (red), 20 (green), 30 (dark blue), 40 (light blue) Hz. The signal to noise ratio for each calibration signal is 14.9, 14.5, 11.0, 10.4, and 8.3 respectively. The equivalent field amplitude for the calibration signal is 1.4 pT. We plot the frequency spectrum up to 50 Hz, since the equivalent noise bandwidth of lock-in amplifier is 78 Hz.
