Analysis of dynamic features in intersecting pedestrian flow
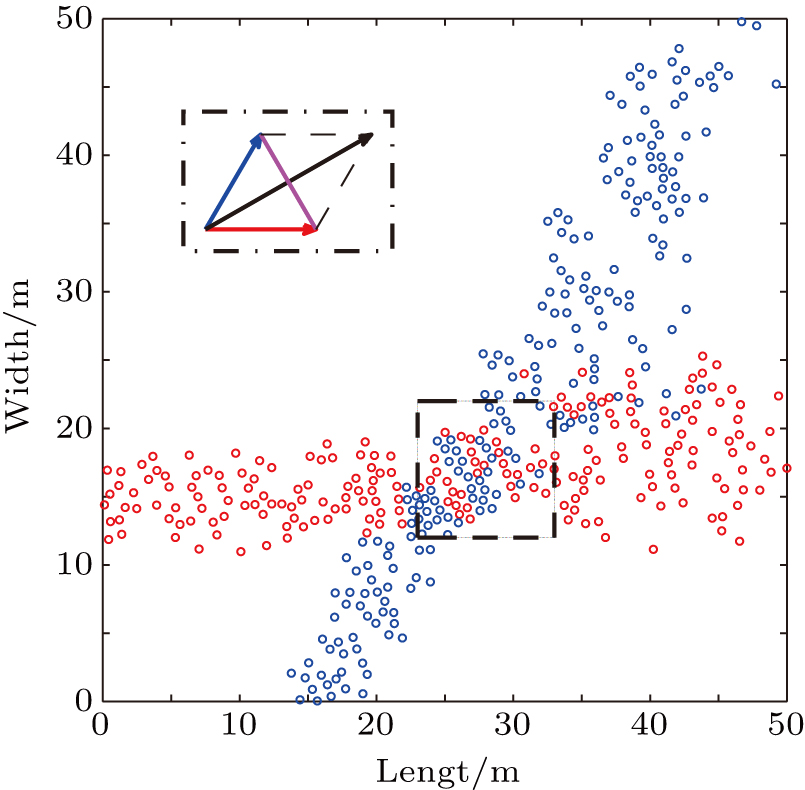
(color online) Stripes formation in scenario 1. The vector diagram in the northwest is a contrast from the perspective of geometry. The coordinates of the statistical area’s vertexes are (23 m, 22 m), (33 m, 22 m), (33 m, 12 m), and (23 m, 12 m).