Analysis of dynamic features in intersecting pedestrian flow
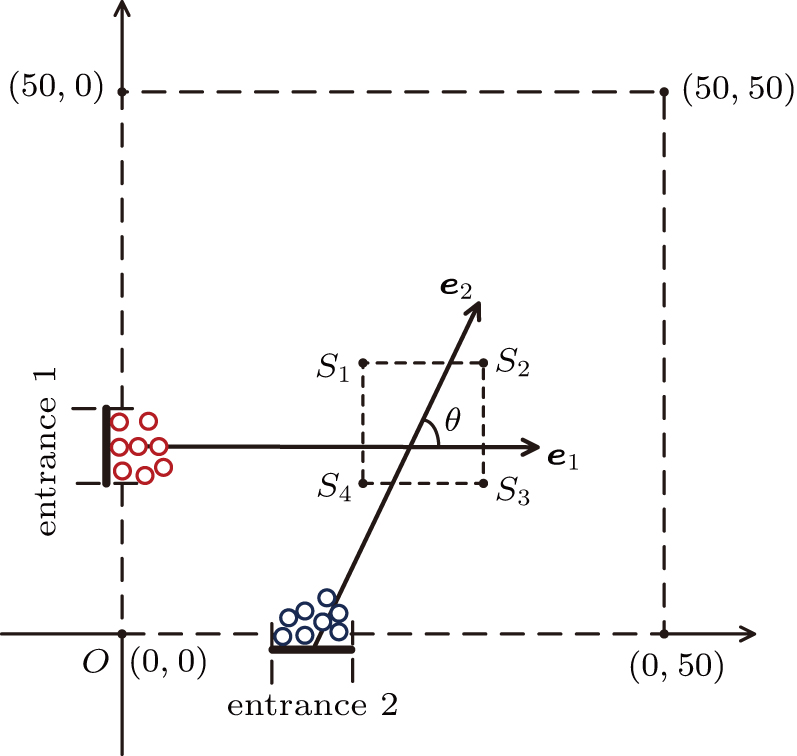
(color online) Schematic diagram of the simulation scenarios. Hollow circles of different colors represent pedestrians walking in different directions, which are e1 and e2. θ represents the cross angle. The dashed square in the center of the area is the statistical area.