Direct measurement and analysis of total ionizing dose effect on 130 nm PD SOI SRAM cell static noise margin
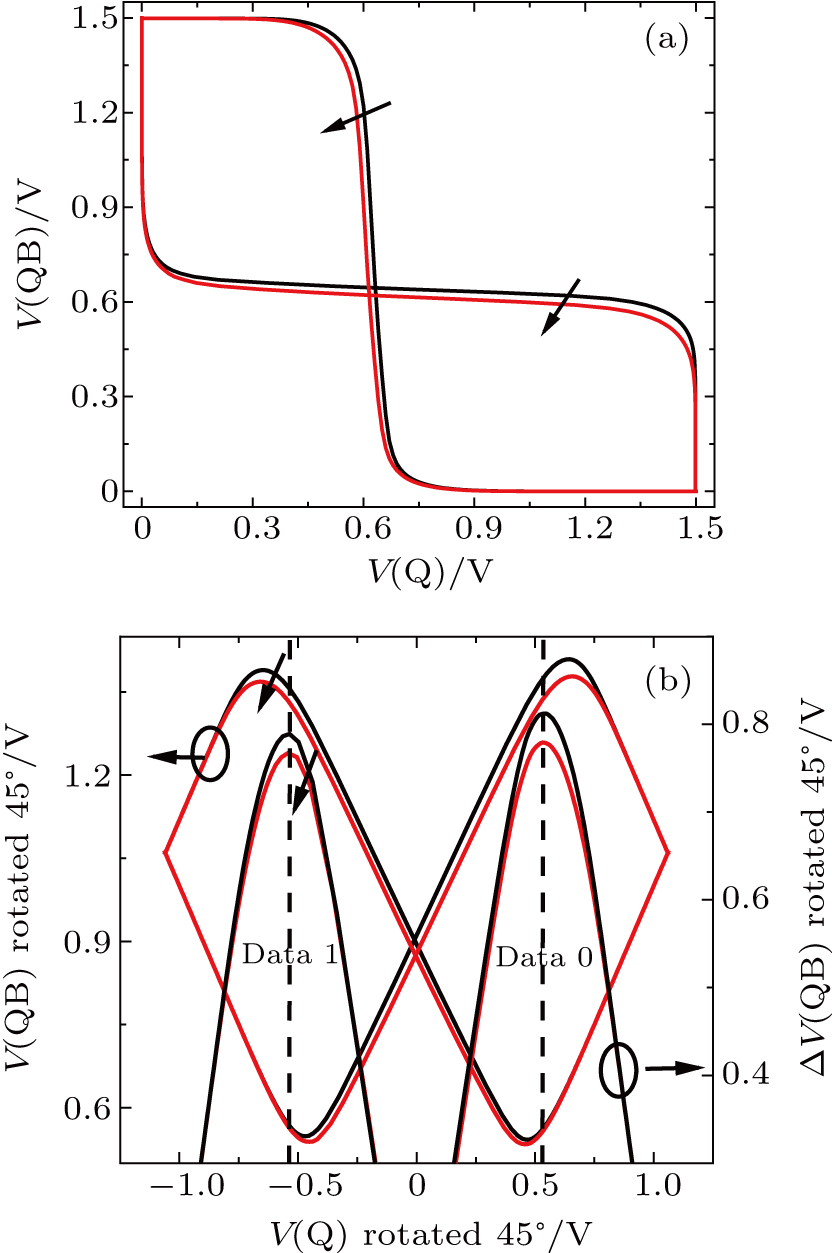
(color online) The tested SNM of SRAM cell pre and post TID. The black line represents data of pre irradiation and the red line represents data post 500 krad(Si). (a) Butterfly curves pre and post 500 krad(Si). (b) SNM estimation based on maximum squares in a 45° rotated coordinate system relative to panel (a).