Structural deformation of nitro group of nitromethane molecule in liquid phase in an intense femtosecond laser field
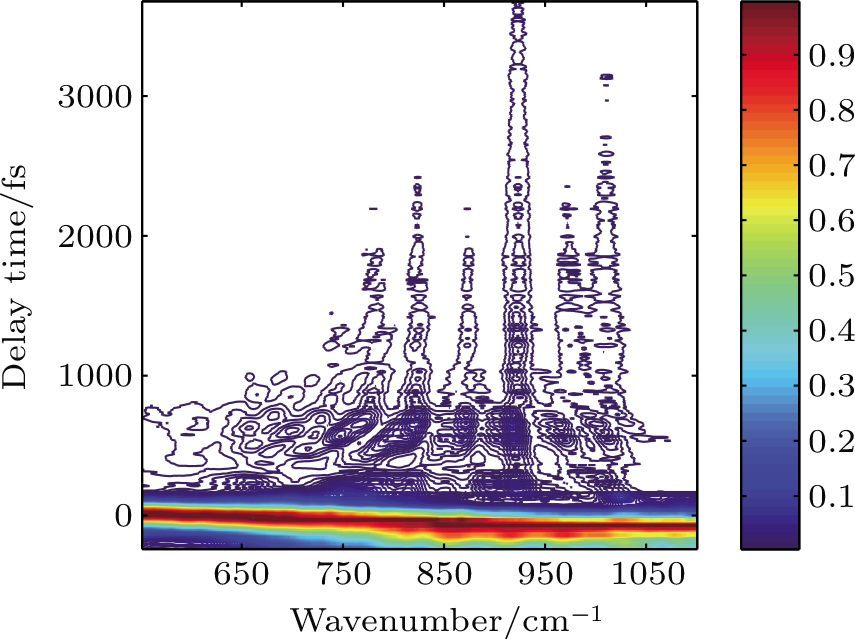
(color online) Contour plot of time- and frequency-resolved CARS spectra of liquid NM when the pump intensity is 5 μJ. The two axes represent delay time and Raman vibrational frequency values, while contours represent the normalized intensity of the CARS signal. The peak intensity of every spectral position has been normalized to 1.
