Elastic strain response in the modified phase-field-crystal model
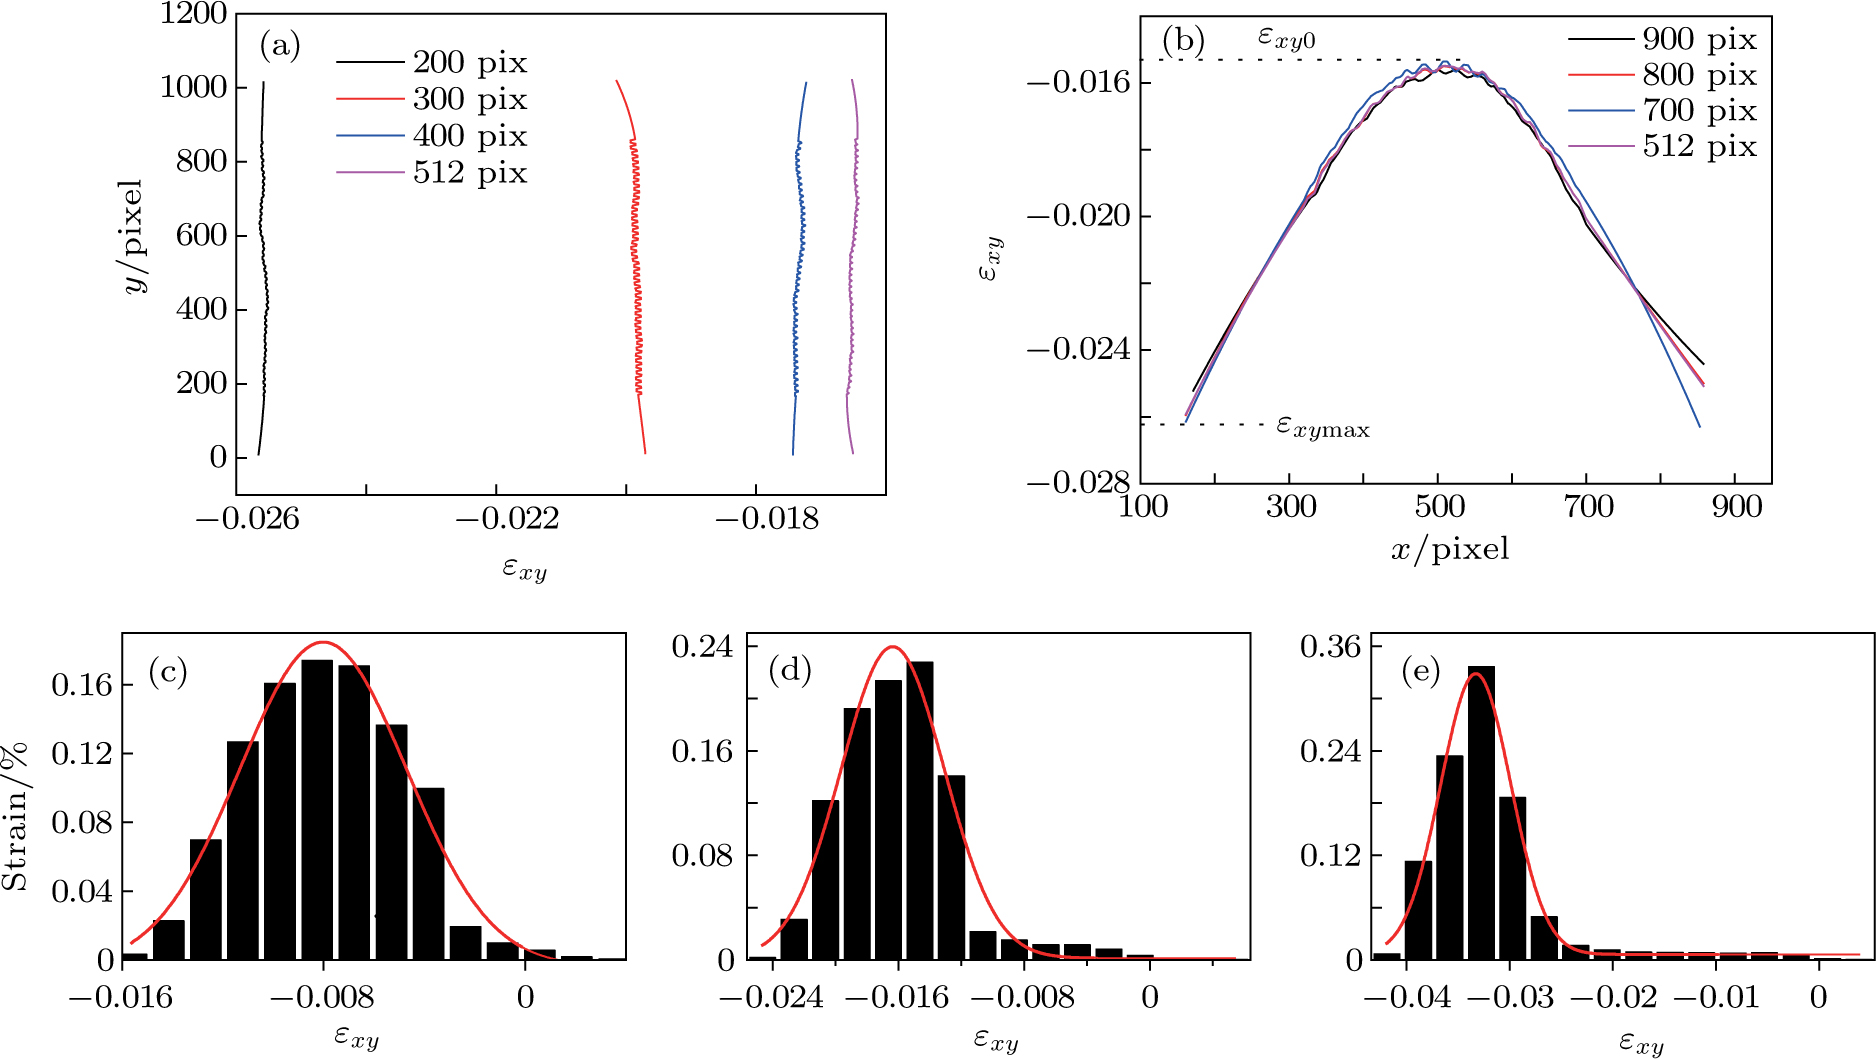
(color online) Shear strain distributions over the nano-single crystal specimen. Strain data in panels (a) and (b) are extracted from the four fixed line regions in Fig.

Elastic strain response in the modified phase-field-crystal model |
|
(color online) Shear strain distributions over the nano-single crystal specimen. Strain data in panels (a) and (b) are extracted from the four fixed line regions in Fig. |
 |