Thermo-controllable self-assembled structures of single-layer 4, 4″-diamino-p-terphenyl molecules on Au (110)
Ren Junhai1, Bao De-Liang1, Dong Li1, Gao Lei1, Wu Rongting1, Yan Linghao1, Wang Aiwei1, Yan Jiahao1, Wang Yeliang1, 2, Du Shi-Xuan1, 2, †, Huan Qing1, 2, ‡, Gao Hong-Jun1, 2
Institute of Physics & University of Chinese Academy of Sciences, Chinese Academy of Sciences (CAS), Beijing 100190, China
Beijing Key Laboratory for Nanomaterials and Nanodevices, Beijing 100190, China


† Corresponding author. E-mail: sxdu@iphy.ac.cn huanq@iphy.ac.cn

Abstract

Here we report the thermo-controllable self-assembled structures of single-layer 4, 4″-diamino-p-terphenyl (DAT) molecules on Au (110), which are investigated by scanning tunneling microscopy (STM) combined with density functional theory (DFT) based calculations. With the deposition of monolayer DAT molecules on Au (110) and subsequent annealing at 100 °C, all DAT molecules adsorb on a (1 × 5) reconstructed surface with a ladder-like structure. After annealing the sample at about 200 °C, STM images show three distinct domains, including DAT molecules on a (1 × 3) reconstructed surface, dehydrogenated molecules with two hydrogen atoms detached from one amino group (−2H-DAT) on a (1 × 5) reconstructed surface and dehydrogenated molecules with four hydrogen atoms detached from two amino groups (–4H-DAT) on a (1 × 3) reconstructed surface through N–Au bonds. Furthermore, after annealing the sample to 350 °C, STM image shows only one self-assembled structure with −4H-DAT molecules on a (1 × 3) reconstructed surface. Relative STM simulations of different self-assembled structures show excellent agreements with the experimental STM images at different annealing temperatures. Further DFT calculations on the dehydrogenation process of DAT molecule prove that the dehydrogenation barrier on a (1 × 5) reconstructed surface is lower than that on (1 × 3) one, which demonstrate the experimental results that the formation temperature of a (1 × 3) reconstructed surface is higher than that of a (1 × 5) one.

1. Introduction

The self-assembly of two-dimensional (2D) organic molecules on various substrates has been investigated extensively in the past two decades,[111] and has been demonstrated to be an effective way to form well-ordered and interesting structures, such as Kagome lattice,[1,2,9] Sierpinski triangle,[4,11] and so on. In contrast to nanostructures constructed through the intermolecular van der Waals force,[4,5] nanostructures formed through the coordination[1,1214] with specific functional properties, such as tunable size,[15] and topologies,[15] have better potential application in several aspects, such as catalysis,[16] gas storage,[16] and magnetism.[17] 4, 4″-diamino-p-terphenyl (DAT) is a linear molecule with three non-planar phenyl rings and an amino group attached to each end. Because of its fascinating physical properties, DAT has been used to construct polymer light-emitting diodes by vapor deposition polymerization.[18] Notably, DAT molecule has been reported to chemically bound to the substrate through the thermo-controlled dehydrogenation of the amino group.[19,20] Furthermore, the interplay between adsorbates and Au (110) easily induces the formation of distinct surface reconstructions,[2123] making Au (110) an ideal template to construct novel nanostructures for organic molecules,[24] especially linear molecules,[25,26] due to two growth modes, namely the end-to-end mode and the side-by-side mode.[25,27]

In this article, we construct different nanostructures of single-layer DAT molecules on Au (110) by modulating the annealing temperatures. The configurations and the formation mechanism of different structures were systematically explored by STM experiments and DFT calculations. After annealing at 100 °C, DAT molecules were found to form one ladder-like structure in a (1 × 5) surface reconstruction with their long molecular axes parallel to the [001] direction of the Au (110) substrate. While the monolayer sample was annealed at 200 °C, both the (1 × 5) and (1 × 3) surface reconstructions were formed on Au (110) with –2H-DAT molecule in (1 × 5) reconstruction and both intact DAT and –4H-DAT molecules in (1 × 3) reconstruction. Notably, after annealing at 350 °C, –4H-DAT molecules in (1 × 3) surface reconstruction covered the whole Au (110) surface. Further calculations proved that in comparison with –2H-DAT molecules in (1 × 5) surface reconstruction, –4H-DAT molecules in (1 × 3) surface reconstruction were more difficult to form.

2. Methods
2.1. Experimental techniques

Our experiments were accomplished in a homemade UHV-VT-STM with the base pressure better than Torr (1 Torr = 1.33322 Pa), as described elsewhere.[10] Single-crystal Au (110) (MaTeck Company) surface was prepared in UHV chamber by repeated cycles of Ne sputtering and subsequent annealing at 580 °C until the (1 × 2) surface reconstruction was observed by VT-STM. Commercial DAT was purified through sublimation in high vacuum for a couple of days, and further refined by degassing in UHV chamber for several hours. DAT molecule was evaporated at about 120 °C while the Au (110) substrate was kept at 100 K. One monolayer (ML) refers to the amount of deposited DAT molecules that completely cover the substrate surface. All STM images were obtained in constant-current mode and the bias was applied to the sample, with both the sample and the tip at 100 K.

2.2. Computational methods

DFT calculations were performed by Vienna ab-initio simulation package (VASP) code.[28] The projector augmented wave (PAW)[29] method was used to describe the interaction between the ions and electrons, and the Perdew–Burke–Ernzerhof (PBE)[30] generalized gradient approximation (GGA)[31] exchange–correlation functional was employed. The plane-wave energy cutoff is 400 eV. The molecule–substrate system was modeled within the supercell approach and contained five layers of Au atoms with adsorbed molecules on one side. The vacuum layer is about 18 Å. Two supercells with 3 × 5 and 8 × 3 of Au (110) were constructed. In structural relaxations, two bottom Au layers were fixed, while the other Au atoms and the molecule were fully relaxed until the force for each atom was less than 0.02 eV/Å. Van der Waals (vdW) interactions were included using the dispersion corrected DFT-D2 method of Grimme.[32] The nudged elastic band (NEB).[33] calculation was performed to investigate the dehydrogenation pathway for the molecules on surface.

3. Results and discussion

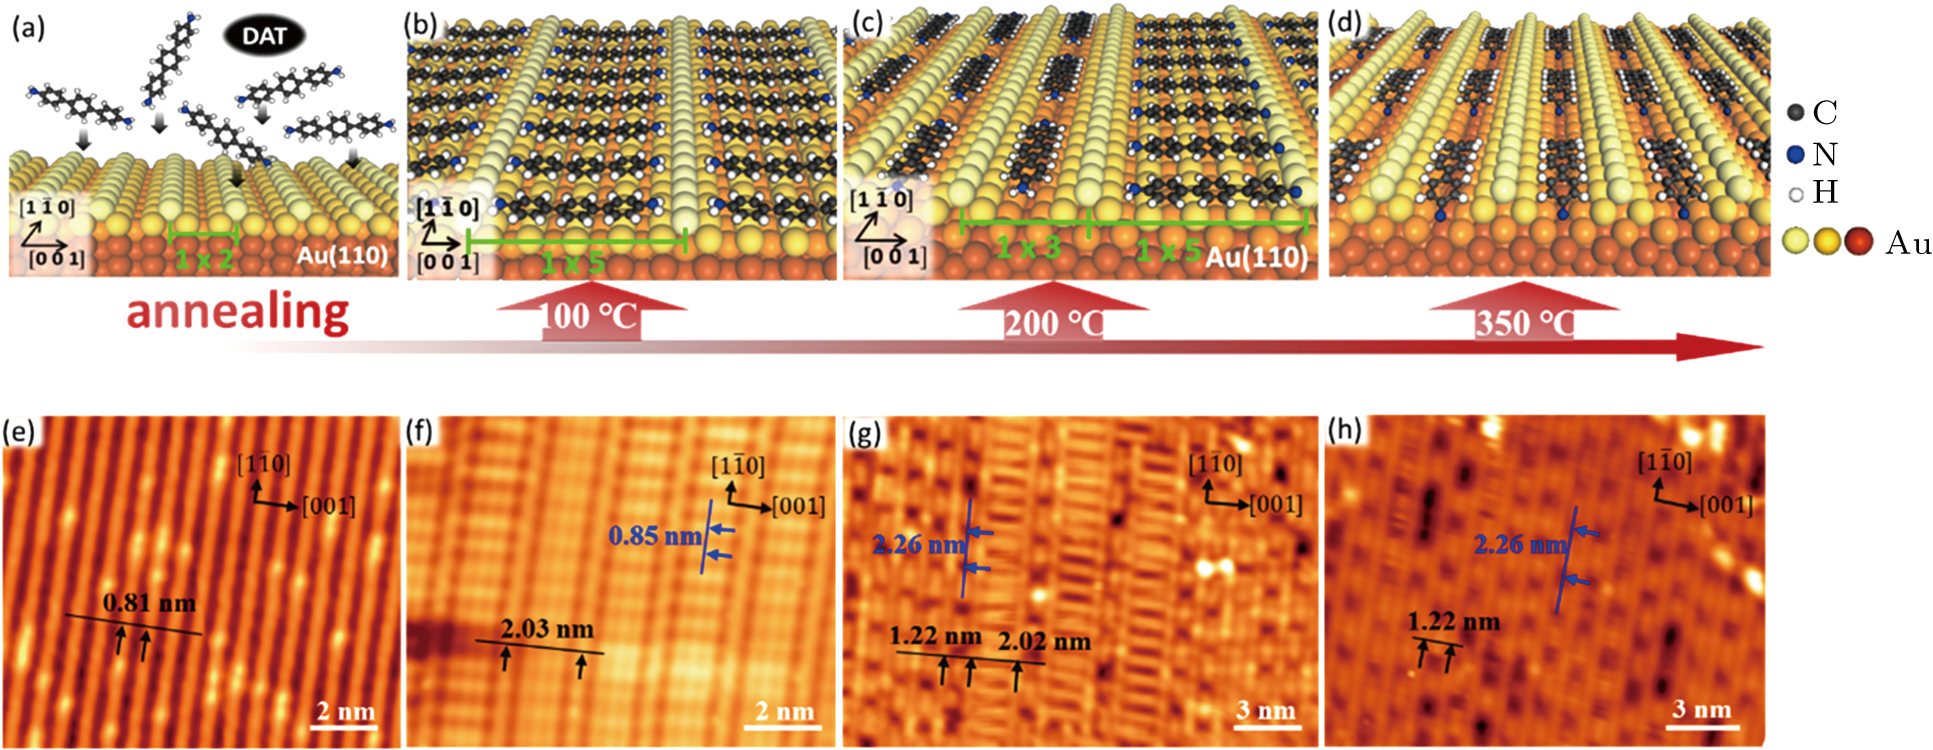
Figure 1 shows the basic procedure for constructing distinct self-assembled structures of single-layer DAT molecules on Au (110) by modulating the annealing temperatures from 100 °C to 350 °C. As shown in Fig. 1(a), we deposited DAT molecules onto a clean Au (110) surface with (1 × 2) reconstructions of 0.81-nm wide channels (see Fig. 1(e)) and subsequently annealed the sample to 100 °C until the formation of a monolayer structure. The STM image (Fig. 1(f)) of monolayer DAT molecules shows that after annealing at 100 °C, there is a new reconstruction on Au (110) with a channel width of 2.03 nm, about times of the Au–Au bond length (0.29 nm), indicating the formation of a (1 × 5) reconstruction. DAT molecules are uniformly located in the (1×5) reconstruction, with their long axes along the [001] direction, forming a ladder-like structure. The distance between neighboring DAT molecules is 0.85 nm, about three times of the Au–Au bond length, suggesting that a 3 × 5 supercell exists on Au (110) for DAT molecules.

Fig. 1. (color online) The self-assembled behaviors of single-layer DAT molecules on Au (110) at different growing conditions. (a) Schematic diagram and (e) large-scale STM image of the original Au (110) surface without molecular deposition. (b), (c), and (d) Schematic diagrams of the Au (110) surface with monolayer DAT molecules after annealing the sample at 100 °C, 200 °C, and 350 °C, respectively, and (f), (g), and (h) the corresponding large-scale STM images of the sample, respectively. The scanning conditions are −0.50 V, 0.1 nA in panel (e), −1.15 V, 0.1 nA in panel (f), −0.60 V, 0.1 nA in panel (g), and −1.22 V, 0.1 nA in panel (h), respectively.

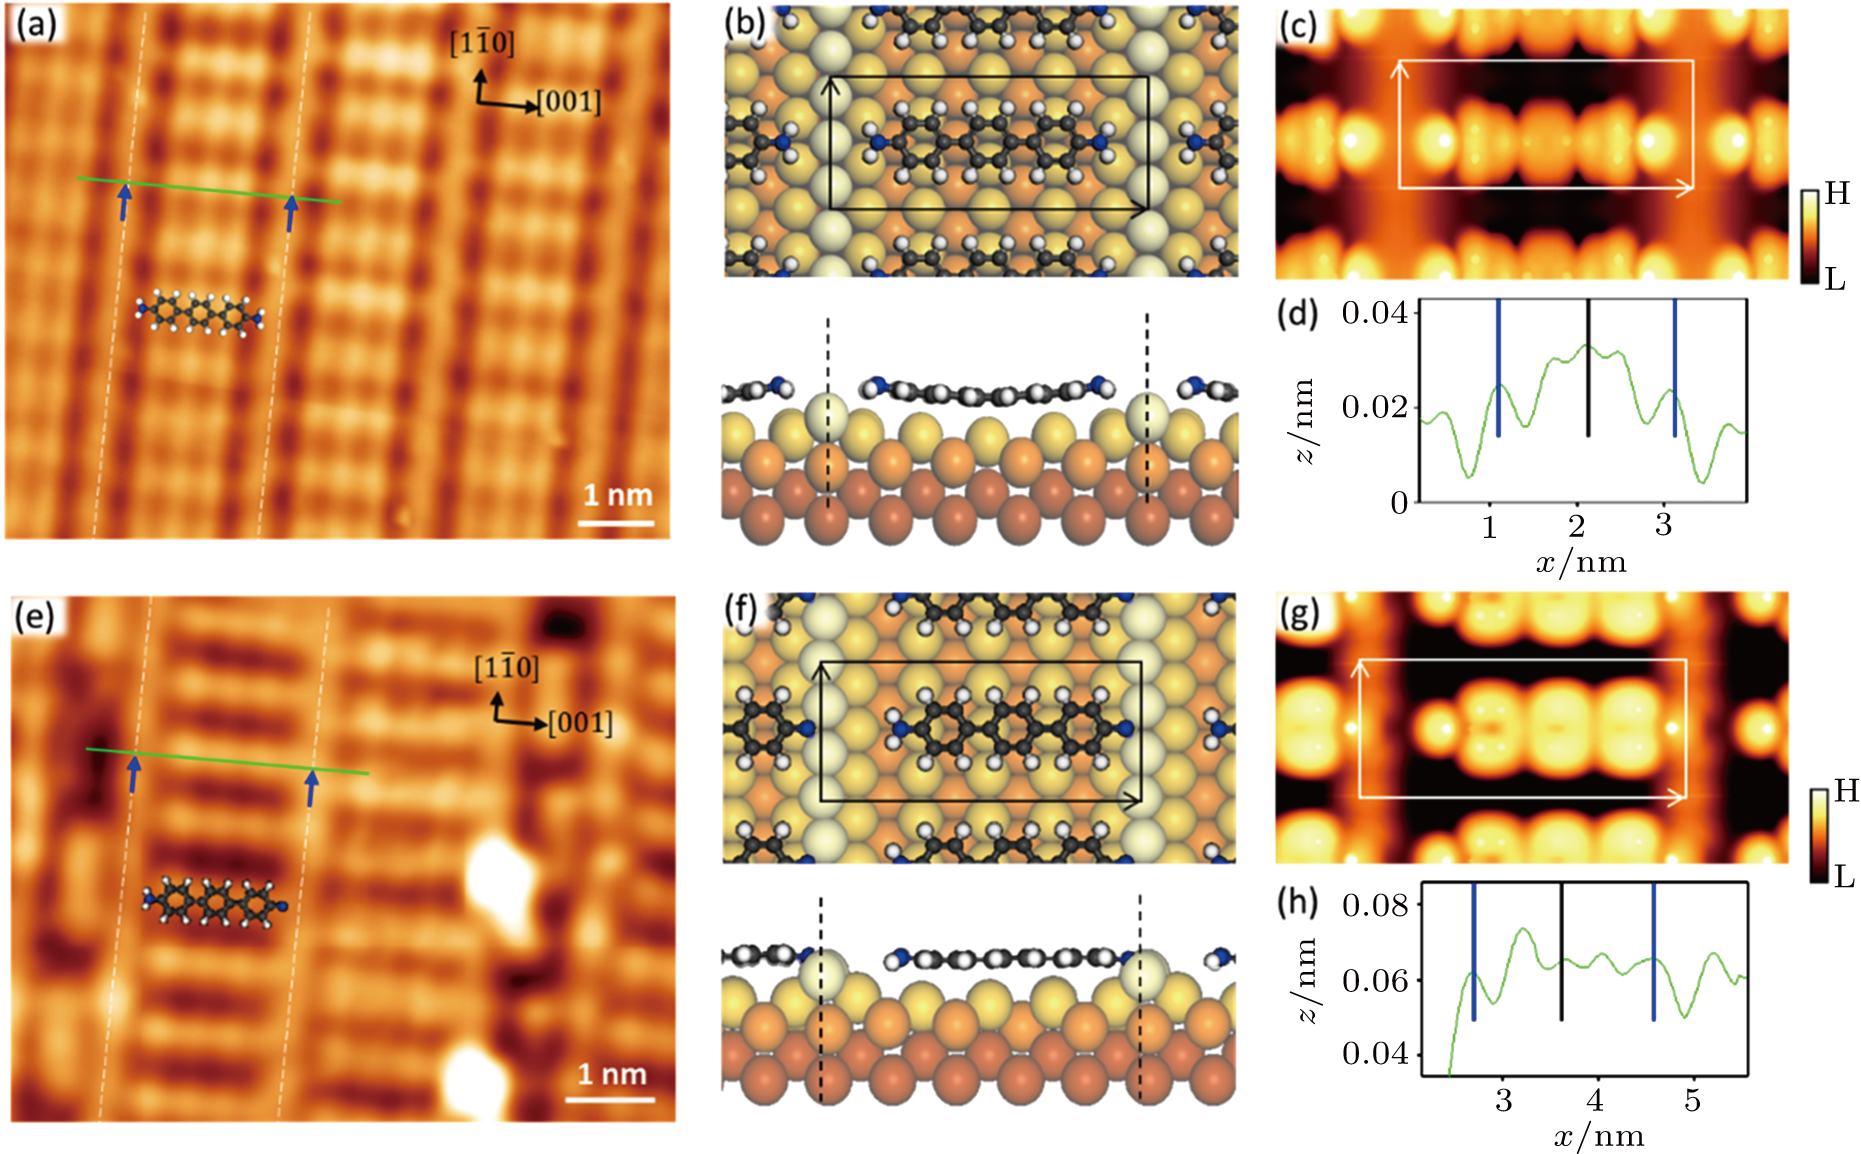
As shown in the high-resolution STM image (Fig. 2(a)), we find out that there are three bright spots for each DAT molecule, which are the three benzene rings of each DAT molecule. Furthermore, figure 2(d) shows a line profile in Fig. 2(a), where the two blue lines indicate one channel of a (1 × 5) reconstruction. We find that the adsorption position of the central benzene ring of DAT is at the center of the (1 × 5) reconstruction (the black line). In order to better understand the adsorption configuration of the DAT molecule on Au (110), DFT calculations were carried out and the results are illustrated in Figs. 2(b)2(c). Our simulated STM image and corresponding line profile show that the DAT molecule is at the center of the (1 × 5) reconstruction and agree well with the experimental images very well.

Fig. 2. (color online) The comparison of the DAT molecular structures in the Au (110)-(1 × 5) reconstruction after annealing the monolayer sample at 100 ° and 200 °C, respectively. (a), (b), and (c) High-resolution STM image, structural models, and simulated STM image of DAT molecules in (1 × 5) reconstruction after annealing at 100 °C, respectively. (d) A line profile in Fig. 2(a). (e), (f), and (g) High-resolution STM image, structural models, and simulated STM image of DAT molecules in (1 × 5) reconstruction after annealing at 200 °C, respectively. (h) A line profile in Fig. 2(e). The scanning conditions are −1.33 V, 0.1 nA in panel (a) and −0.76 V, 0.1 nA in panel (e), respectively.

While the monolayer sample was annealed at 200 °C, we observed the co-existence of (1 × 5) and (1 × 3) surface reconstructions with side-by-side and end-to-end molecular adsorption configurations, respectively (Fig. 1(g)). As for DAT molecules in the (1 × 5) reconstruction, after careful analysis of the high-resolution STM image (Fig. 2(e)) and the line profile (Fig. 2(h)), we find that the DAT molecules adsorb slightly off-center and are close to the right side of channels. We infer that the amino groups of the DAT molecule may be dehydrogenated when annealing at 200 °C.[34] In order to know the exact configuration of the dehydrogenated molecules, we performed DFT calculations and STM simulation on several possible configurations. Figures 2(f) and 2(g) show the most likely configuration and corresponding simulated STM image. According to the structural model of DAT molecule in Fig. 2(f), one of the amino groups binds to two gold atoms by losing two hydrogen atoms. In comparison with DAT molecule in Fig. 2(b), there is a shift along the direction (about 0.145 nm, half Au–Au bond length) and a shift along the direction (about 0.17 nm) for single DAT molecule. Furthermore, because of the dehydrogenation of DAT molecule, there is a small gap between single DAT molecule and the left side of the (1 × 5) reconstruction channel, which is also observed in the STM image Fig. 2(e). Therefore, the new ladder-like structure is formed with dehydrogenated molecules (–2H-DAT) after annealing at 200 °C.

Another structure of molecules on a (1 × 3) reconstructed surface (see Fig. 1(g)) with a distance of 2.26 nm, about 8 times the Au–Au bond length, between neighboring DAT molecules, was also observed after annealing at 200 °C. High-resolution STM image (Fig. 3(a)) shows that there are two different types of DAT molecules. One is marked by the red arrow with a length of 1.49 nm, which is close to the length of a single DAT molecule (1.52 nm). The other is marked by the green arrow with a length of 1.13 nm, which is significantly shorter than the length of a single molecule. Therefore, it is clear that the molecules with a length of 1.49 nm are original molecules without dehydrogenation. The other DAT molecules should be dehydrogenated molecules.

Fig. 3. (color online) The comparison of DAT molecular structures in the Au (110)-(1×3) reconstruction after annealing the monolayer sample at 200 °C and 350 °C, respectively. (a) and (b) High-resolution STM images of DAT molecules in (1 × 3) reconstruction after annealing at 200 °C and 350 °C, respectively. (c), (d), (e), and (f) Structural models and simulated STM images of two types of DAT molecules in (1 × 3) reconstruction after the annealing, respectively. The scanning conditions are −1.15 V, 0.1 nA in panel (a) and −1.22 V, 0.1 nA in panel (b), respectively.

In order to reveal the configuration of the molecules and how many hydrogen atoms are detached from the original ones, we carried out DFT calculations and did STM simulations. The results are shown in Figs. 3(c)3(f). As for the original DAT molecules on a (1 × 3) reconstruction, the molecules absorb along the (1 × 3) reconstructed channel with a length of 1.43 nm. The simulated STM image shows three bright spots at the center and one small spot at each end. Considering the measurement error of the molecular length shown in the experimental STM image, we think that our simulation is in agreement with the experimental results and the molecule in Fig. 3(a) with a length of 1.49 nm is an original DAT molecule. According to the DFT calculation in Fig. 3(e), the DAT molecule with dehydrogenation of amino groups at both ends becomes shorter with a length of 1.12 nm. Furthermore, as shown in the relative simulated STM image Fig. 3(f), three benzene rings of DAT molecule show bright spots while two ends of DAT molecule show dark features. Therefore, we make sure that the molecule with a length of 1.13 nm is dehydrogenated at both ends with the molecular structure of –4H-DAT.

In order to know the structure of the sample at a higher temperature, we annealed the sample at 350 °C, and the surface completely changed, as shown in Fig. 1(h). There is only (1 × 3) surface reconstruction with the distance between the neighboring DAT molecules 2.26 nm. The high-resolution STM image figure 3(b) shows three bright spots for single DAT molecule, indicating three benzene rings. The lengths of the molecules are all about 1.13 nm, which means that all molecules after annealing at 350 °C are dehydrogenated at both ends (–4H-DAT). Therefore, we can control the self-assembled structures of DAT molecules on Au (110) through annealing temperatures at monolayer level.

The calculated dehydrogenation processes of the amino groups at both ends of DAT molecules in reconstructed channels are shown in Fig. 4. For DAT molecules in the (1 × 3) reconstructed channels (Fig. 4(a)), the H atom (red ball in Fig. 4(a)) breaks off from the N atom and bonds to the neighboring Au on surface with a barrier of 2.26 eV. For DAT molecules in the (1 × 5) reconstructed channels (Fig. 4(c)), the dehydrogenation process is similar with that in (1 × 3) channels. However, the barrier decreases to 1.8 eV. As a result, the dehydrogenation process in a 1 × 5 channel is much easier than that in (1 × 3) channels.

Fig. 4. (color online) The reaction path of dehydrogenation for the DAT molecules in (1 × 3) and (1 × 5) reconstructed channels. The structures of initial states (IS), intermediate states (TS), and final states (FS) for the dehydrogenation of DAT molecules in (1 × 3) and (1 × 5) reconstructed channels are shown in panels (a) and (c). (b) The energy profile during the reactions paths. Red lines represent the barrier in path in panel (a), and the black lines represent the barrier in path in panel (c).
4. Conclusion

By combining the STM experiments with DFT calculations, we systematically explored the thermo-controlled configuration transformations and formation mechanism of the self-assembled single-layer DAT molecules on Au (110) surface. At a low annealing temperature of 100 °C, DAT molecules only form one ladder-like structure in the (1 × 5) surface reconstructed channels. At a high annealing temperature of 200 °C, the amino groups of the molecules are partially dehydrogenated. The –2H-DAT and –4H-DAT molecules can be found in both the (1 × 5) and (1 × 3) surface reconstructions, respectively. At a higher annealing temperature of 350 °C, there are only –4H-DAT molecules in the (1 × 3) surface reconstructions. The investigation on these novel self-assembled structures, which is combined with surface reconstruction and dehydrogenation process, enriches our knowledge of the self-assembly behavior of organic molecules on metal surfaces.

Reference
[1] Shi Z L Lin N 2009 J. Am. Chem. Soc. 131 5376
[2] Shi Z L Lin N 2010 J. Am. Chem. Soc. 132 10756
[3] Bartels L 2010 Nat. Chem. 2 87
[4] Sun Q Cai L L Ma H H Yuan C X Xu W 2015 Chem. Commun. 51 14164
[5] Zhang H G Xiao W D Mao J H Zhou H T Li G Zhang Y Liu L W Du S X Gao H J 2012 J. Phys. Chem. 116 11091
[6] Fortuna S Gargiani P Betti M G Mariani C Calzolari A Modesti S Fabris S 2012 J. Phys. Chem. 116 6251
[7] Yang K Xiao W D Jiang Y H Zhang H G Liu L W Mao J H Zhou H T Du S X Gao H J 2012 J. Phys. Chem. 116 14052
[8] Chen Q Bae S C Granick S 2011 Nature 469 381
[9] Mao J H Zhang H G Jiang Y H Pan Y Gao M Xiao W D Gao H J 2009 J. Am. Chem. Soc. 131 14136
[10] Wu R T Yan L H Zhang Y F Ren J H Bao D L Zhang H G Wang Y L Du S X Huan Q Gao H J 2015 J. Phys. Chem. 119 8208
[11] Shang J Wang Y F Chen M Dai J X Zhou X Kuttner J Hilt G Shao X Gottfried J M Wu K 2015 Nat. Chem. 7 389
[12] Liu J Lin T Shi Z L Xia F Dong L Liu P N Lin N 2011 J. Am. Chem. Soc. 133 18760
[13] Wang X Y Zhao F P Wang J Yan Y B 2016 Acta Phys. Sin. 65 178105 in Chinese
[14] Peng Y Luo X X Fu Y Xing M M 2013 Acta Phys. Sin. 62 208105 in Chinese
[15] Barth J V Costantini G Kern K 2005 Nature 437 671
[16] Furukawa H Cordova K E O’Keeffe M Yaghi O M 2013 Science 341 1230444
[17] Kurmoo M 2009 Chem. Soc. Rev. 38 1353
[18] Itabashi A Fukushima M Murata H 2008 Jpn. J. Appl. Phys. 47 1271
[19] Nishimura T Sasahara A Murata H Arai T Tomitori M 2014 J. Phys. Chem. 118 25104
[20] Nishimura T Itabashi A Sasahara A Murata H Arai T Tomitori M 2010 J. Phys. Chem. C 114 11109
[21] Betti M G Gargiani P Mariani C Turchini S Zema N Fortuna S Calzolari A Fabris S 2012 J. Phys. Chem. 116 8657
[22] Zhong D Y Franke J H Podiyanachari S K Blomker T Zhang H M Kehr G Erker G Fuchs H Chi L F 2011 Science 334 213
[23] Walen H Liu D J Oh J Yang H J Kim Y Thiel P A 2015 J. Phys. Chem. 119 21000
[24] Rauls E Schmidt W G Pertram T Wandelt K 2012 Surf. Sci. 606 1120
[25] Guaino P Carty D Hughes G McDonald O Cafolla A A 2004 Appl. Phys. Lett. 85 2777
[26] Cui P Zhang Q Zhu H B Li X X Wang W Y Li Q X Zeng C G Zhang Z Y 2016 Phys. Rev. Lett. 116 026802
[27] Floreano L Cossaro A Cvetko D Bavdek G Morgante A 2006 J. Phys. Chem. 110 4908
[28] Vanderbilt D 1990 Phys. Rev. 41 7892
[29] Kresse G Joubert D 1999 Phys. Rev. B 59 1758
[30] Perdew J P Burke K Ernzerhof M 1996 Phys. Rev. Lett. 77 3865
[31] Perdew J P Chevary J A Vosko S H Jackson K A Pederson M R Singh D J Fiolhais C 1992 Phys. Rev. 46 6671
[32] Wu X Vargas M C Nayak S Lotrich V Scoles G 2001 J. Chem. Phys. 115 8748
[33] Sheppard D Terrell R Henkelman G 2008 J. Chem. Phys. 128 134106
[34] Knor M Gao H Y Amirjalayer S Studer A Gao H J Du S X Fuchs H 2015 Chem. Commun. 51 10854