Fiber-based joint time and frequency dissemination via star-shaped commercial telecommunication network
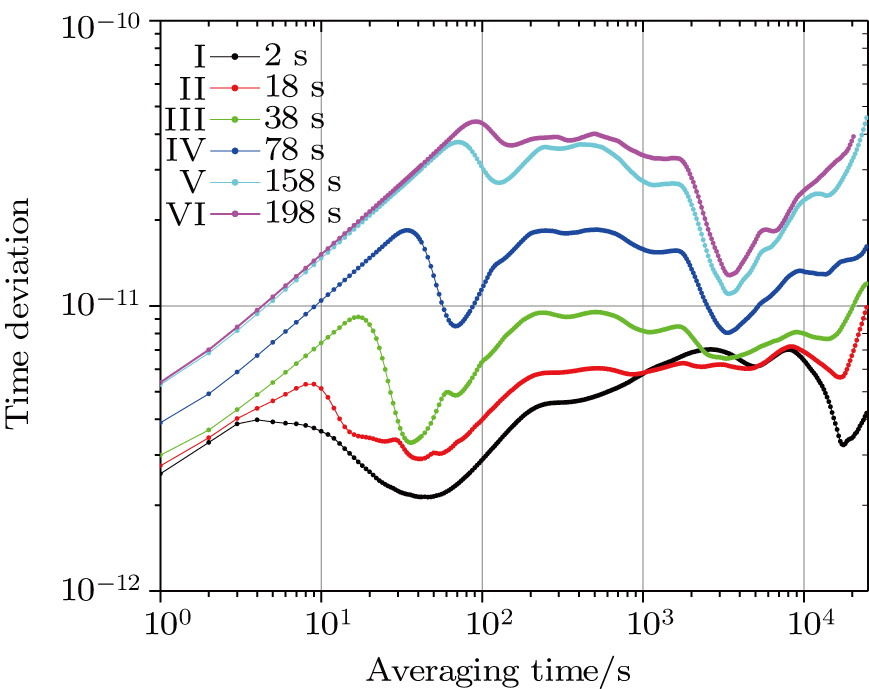
(color online) Time deviations of the recovered timing signals for different latency times. Black curve I: latency time of 2 s. Red curve II: latency time of 18 s. Green line curve III: latency time of 38 s. Blue curve IV: latency time of 78 s. Cyan line V: latency time of 158 s. Magenta curve VI: latency time of 198 s. To show these lines more clearly, all tau modes in the Stable 32 software are selected when processing these data.
