Fiber-based joint time and frequency dissemination via star-shaped commercial telecommunication network
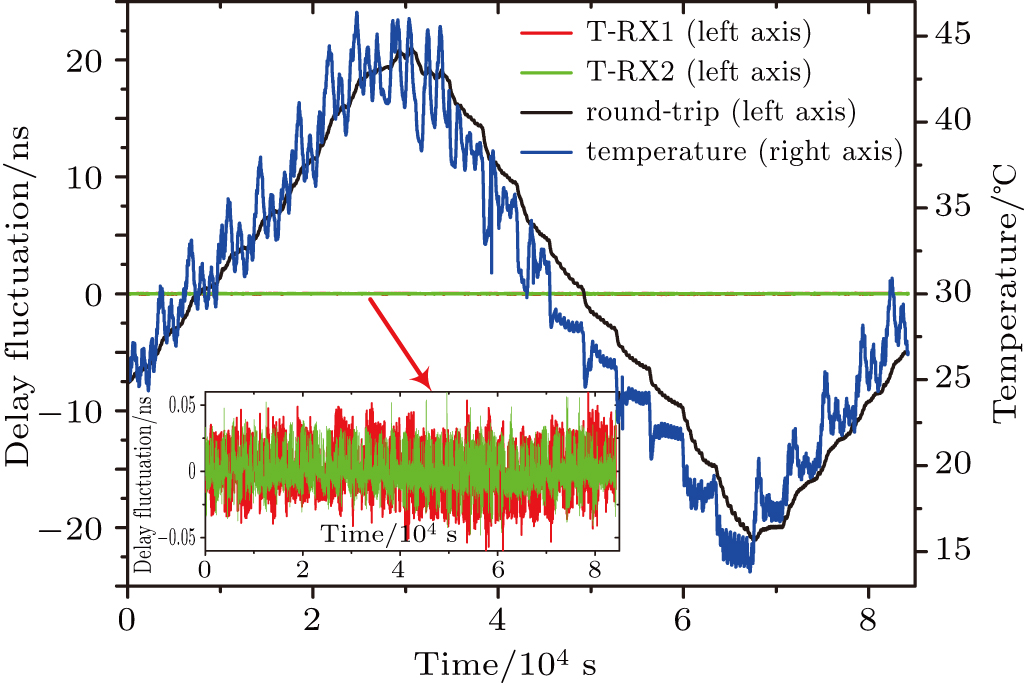
(color online) Double Y plot of temperature and measured time delay fluctuations over a period of one day. Black curve: time delay fluctuation of free-running round trip transfer. Red curve: time delay fluctuation of the timing signal recovered from T-RX1. Green curve: time delay fluctuation of the timing signal recovered from T-RX2. Blue curve: temperature fluctuations of the fiber spools. Inset: fluctuation details of the timing signals recovered from T-RX1 and T-RX2.
