|
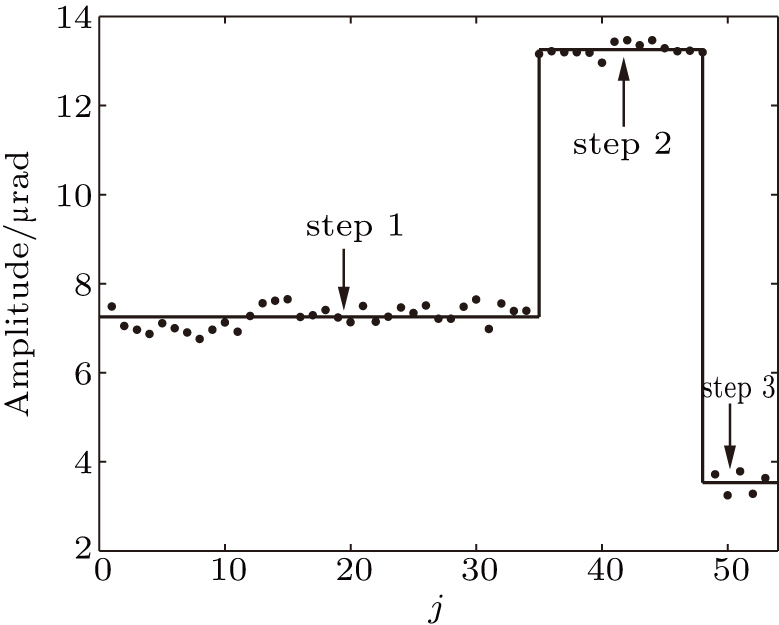
Fitting amplitudes of the
 signal in the j-th segment. Horizontal and vertical axes denote the number of the segments and amplitude of
 signal in the j-th segment, respectively. There are 53 segments in the figure. The black points are fitting amplitude of the
 signal in the j-th segment. The vertical ordinate of the black line is the average value of the amplitude of
 signal in each step. The arrow steps 1, 2, and 3 mark the first, second, and third steps, respectively. The sum of segments for the first, second, and third steps are 34, 14, and 5 separately.
|


