Electronic structure of heavy fermion system CePt2In7 from angle-resolved photoemission spectroscopy
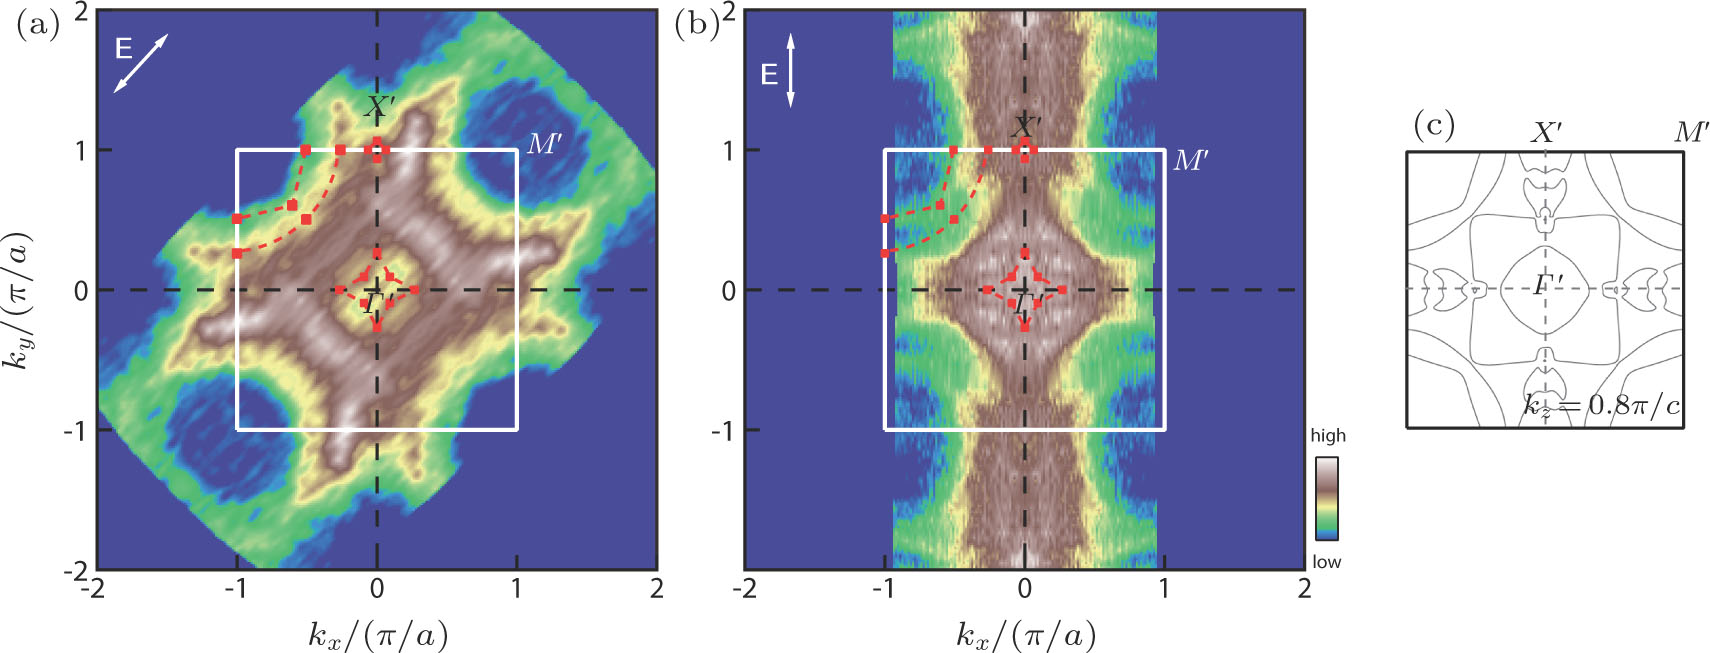
Measured Fermi surface of CePt2In7 and their comparison with calculated one. (a) Fermi surface measured with the electric field direction of the incident light along the diagonal direction, as indicated by the while line in top-left corner. Here the original data were taken in the area covered by (−2, 2)–(0, 0)–(2, 2) region, and the full Fermi surface is obtained by symmetrizing the original data using four-fold symmetry. (b) Fermi surface measured with the electric field direction of the incident light vertical. The spectral weight is obtained by integrating over [0, 100 meV] energy window near the Fermi level. Here the original data were taken in the area covered by (−2, 0)–(0, 0)–(0, 2) region, and the full Fermi surface is obtained by symmetrizing the original data using four-fold symmetry. The thick white square marks the first Brillouin zone boundary. The symbols in (a) and (b) represent Fermi momenta obtained from detailed band structure measurements as shown in Figs.