|
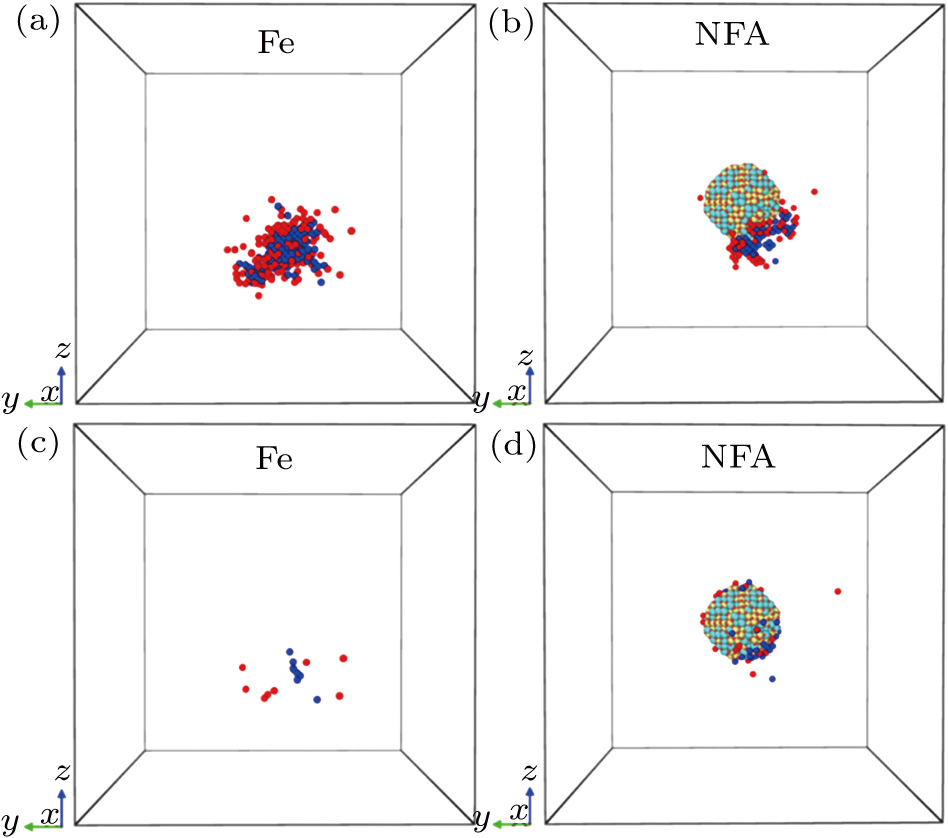
(color online) Snapshots of defect configurations at different times of cascade simulations for pure Fe and the NFA with  keV, ((a), (b)) at defect spike stage, and ((c), (d)) at 20 ps. Red spheres are Fe interstitials, blue spheres are Fe vacancies, and those Fe atoms on lattice sites are not shown. Those defects in the interface region identified via WS cell method are shown for an intuitive view of interface structure change upon cascade damage, yet they are not counted in defect statistics of the matrix. The figure chooses the data in one of 10 simulations, which are closest to average value. keV, ((a), (b)) at defect spike stage, and ((c), (d)) at 20 ps. Red spheres are Fe interstitials, blue spheres are Fe vacancies, and those Fe atoms on lattice sites are not shown. Those defects in the interface region identified via WS cell method are shown for an intuitive view of interface structure change upon cascade damage, yet they are not counted in defect statistics of the matrix. The figure chooses the data in one of 10 simulations, which are closest to average value.
|