|
Hu Xiaohong1, 2, 3, Zhang Wei1, Liu Yuanshan1, Feng Ye1, Zhang Wenfu1, Wang Leiran1, Wang Yishan1, 3, †, Zhao Wei1, 3
|
|
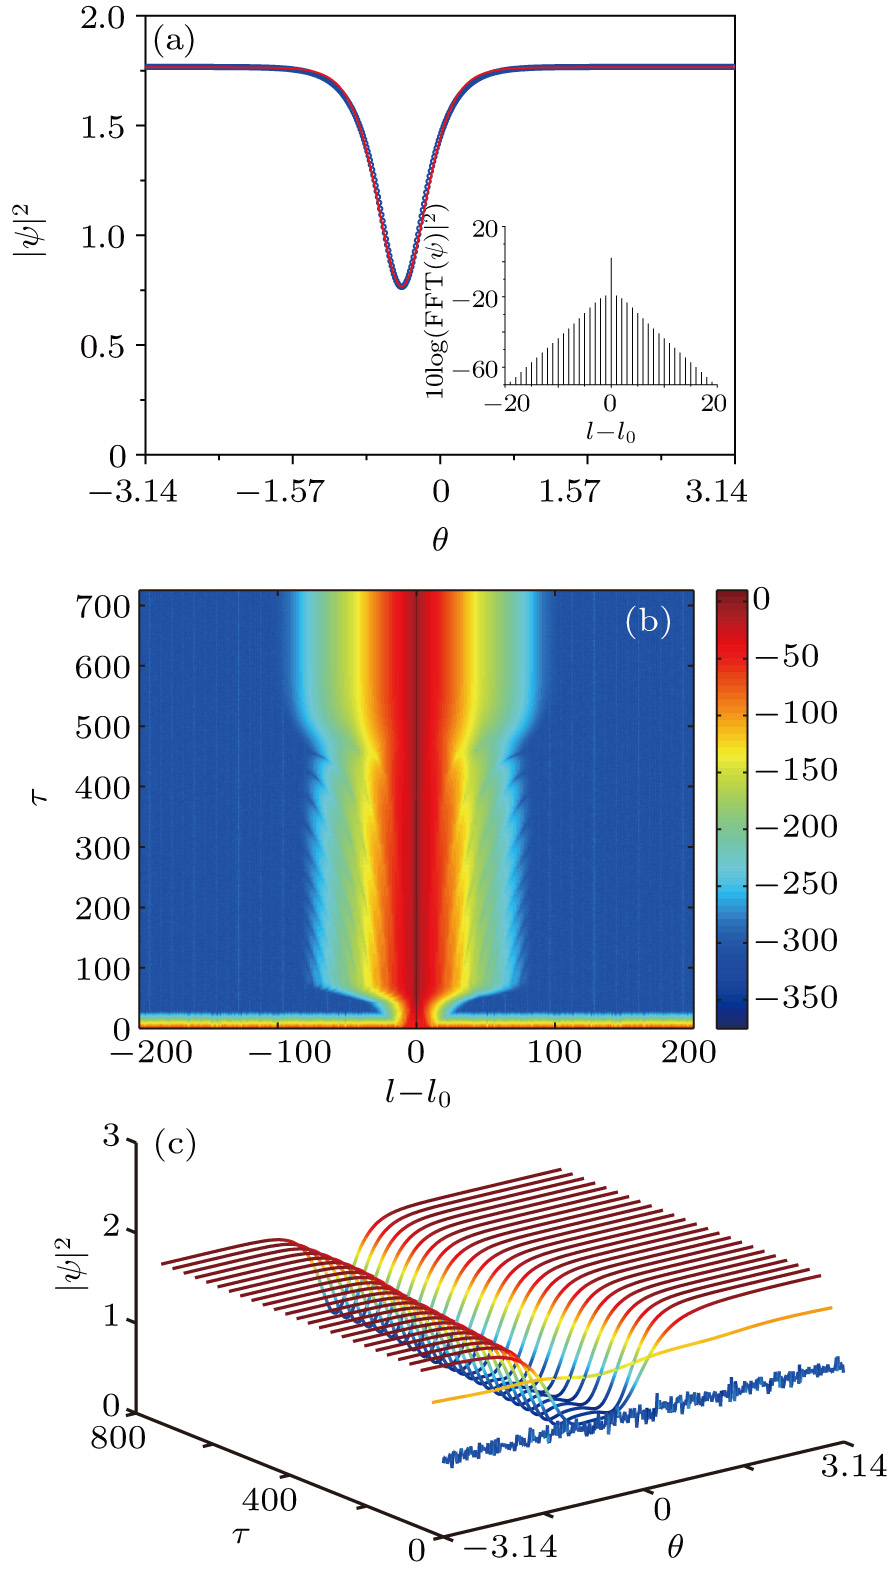
(color online) Dark soliton formation in the region of α<2. (a) Soliton intensity profile. Fitting of the field profile based on Eq. (3) is shown by the blue circles and the inset gives the corresponding comb spectrum. (b) Evolution pattern of spectral intensity represented as a color density plot. (c) Field evolution pattern. The parameters adopted in the process of calculation are: α = 1.95, β = 0.0125, F = 1.353, ρ = 0.853.
|
