† Corresponding author. E-mail:
Colloidal ZnAgInSe (ZAISe) quantum dots (QDs) with different particle sizes were obtained by accommodating the reaction time. In the previous research, photoluminescence (PL) of ZAISe QDs only could be tuned by changing the composition. In this work the size-tunable photoluminescence was observed successfully. The red shift in the photoluminescence spectra was caused by the quantum confinement effect. The time-resolved photoluminescence indicated that the luminescence mechanisms of the ZAISe QDs were contributed by three recombination processes. Furthermore, the temperature-dependent PL spectra were investigated. We verified the regular change of temperature-dependent PL intensity, peak energy, and the emission linewidth of broadening for ZAISe QDs. According to these fitting data, the activation energy (
Quantum dots (QDs) have aroused public attention owing to particular photometric characteristics[1–4]which draw applications for light-emitting diodes,[5,6]photovoltaic cells,[7]bio-labeling,[8]QD lasers,[9,10]and photocatalytics.[11]Most luminescent QDs used are commonly II–VI or IV–VI nanocrystals like binary CdSe, CdTe QDs, which contained potential toxic elements.[12–14]Therefore, significant attention has been paid to the new generation of cadmium-free QDs, which are designed and developed for scientific research and application to substitute the heavy metal element included in QDs. A new synthesis method of solution-phase was used successfully to prepare a series of ternary I–III–VI QDs[15]based on 


In recent years, several reports about ZAISe QDs[28–30]have triggered much attention because of the stability of selenide. In the literature, the photoluminescence (PL) of ZAISe QDs can be tuned by changing the composition. By controlling the Ag/Zn feed ratio the PL emission could be systematically tuned from 660 nm to 800 nm. The obtained ZAISe QDs have been applied in biomedical imaging successfully.
The temperature-dependent PL can be applied to measure the variation of the emission intensity, peak energy, and emission width of ZAISe QDs with temperature. The experimental results can provide the information about the exciton–phonon coupling, the radiative and nonradiative relaxation processes, and the PL mechanism in ZAISe QDs.
The average phonon energy and the Huang–Rhys factor involved in the variation were derived.[31]Therefore, the temperature-dependent optical properties of ZCIS, Mn:ZCIS, and 
In this paper, ZAISe QDs with different sizes have been synthesized to finely tune emission wavelength in the visible region. In order to investigate the luminescence mechanism, the temperature dependence of the peak energy, PL intensity, and full width at half maximum (FWHM) are also studied by measuring the temperature-dependent PL spectra of ZAISe QDs. Moreover, the activation energy, the average phonon energy 
Zinc acetate (Zn(OAc)


A four-neck flask was clamped in a heating jacket to which was added Zn(OAc)
A four-neck flask was clamped in a heating jacket to which was added 0.0363 g of AgOAc, SA (0.1137 g), and ODE (2.0 mL) with argon put into it throughout. The mixed solution was heated to 160 °C and remained for 10 minutes. The precursor solution of Ag was acquired and reserved at 50 °C for the following supply.

A four-neck flask was clamped in a heating jacket to which was added 0.0584 g (0.1 mmol) of In(OAc)
A four-neck flask was clamped in a heating jacket to which was added 0.0078 g (0.1 mmol) of Se powder, 2 mL of OLA, and 0.1 mL of DDT. The mixture was stir under an argon flow at room temperature until all dissolved.
The precursor solution of Zn(OAc)

The PL spectra were measured by the Jobin Yvon FluoroLog-3 fluorescence spectrometer, with a 450-W xenon lamp used as the excitation light source. We obtained the absorption spectra using a Hitachi UV-4100 absorption spectrophotometer. The lifetime of the ZAISe QDs was carried out at Horiba Jobin Yvon FluoroLog-3-time-correlated single-photon counting (TCSPC) fluorescence spectrometer, with a pulsed diode light source (Nano LED) with the wavelength of 367 nm. The morphology and sizes of the ZAISe QDs with different reaction time were performed by HITACHI-HT7700 transmission electron microscopes. The Rigaku D/max 2500v/pc x-ray diffractometer was used to obtain the composition by measuring the phase structure of the QDs. Energy dispersive x-ray spectroscopy spectrum of ZAISe QDs was performed by Hitachi S-8010 scanning electron microscopes equipped with an EDX detector.
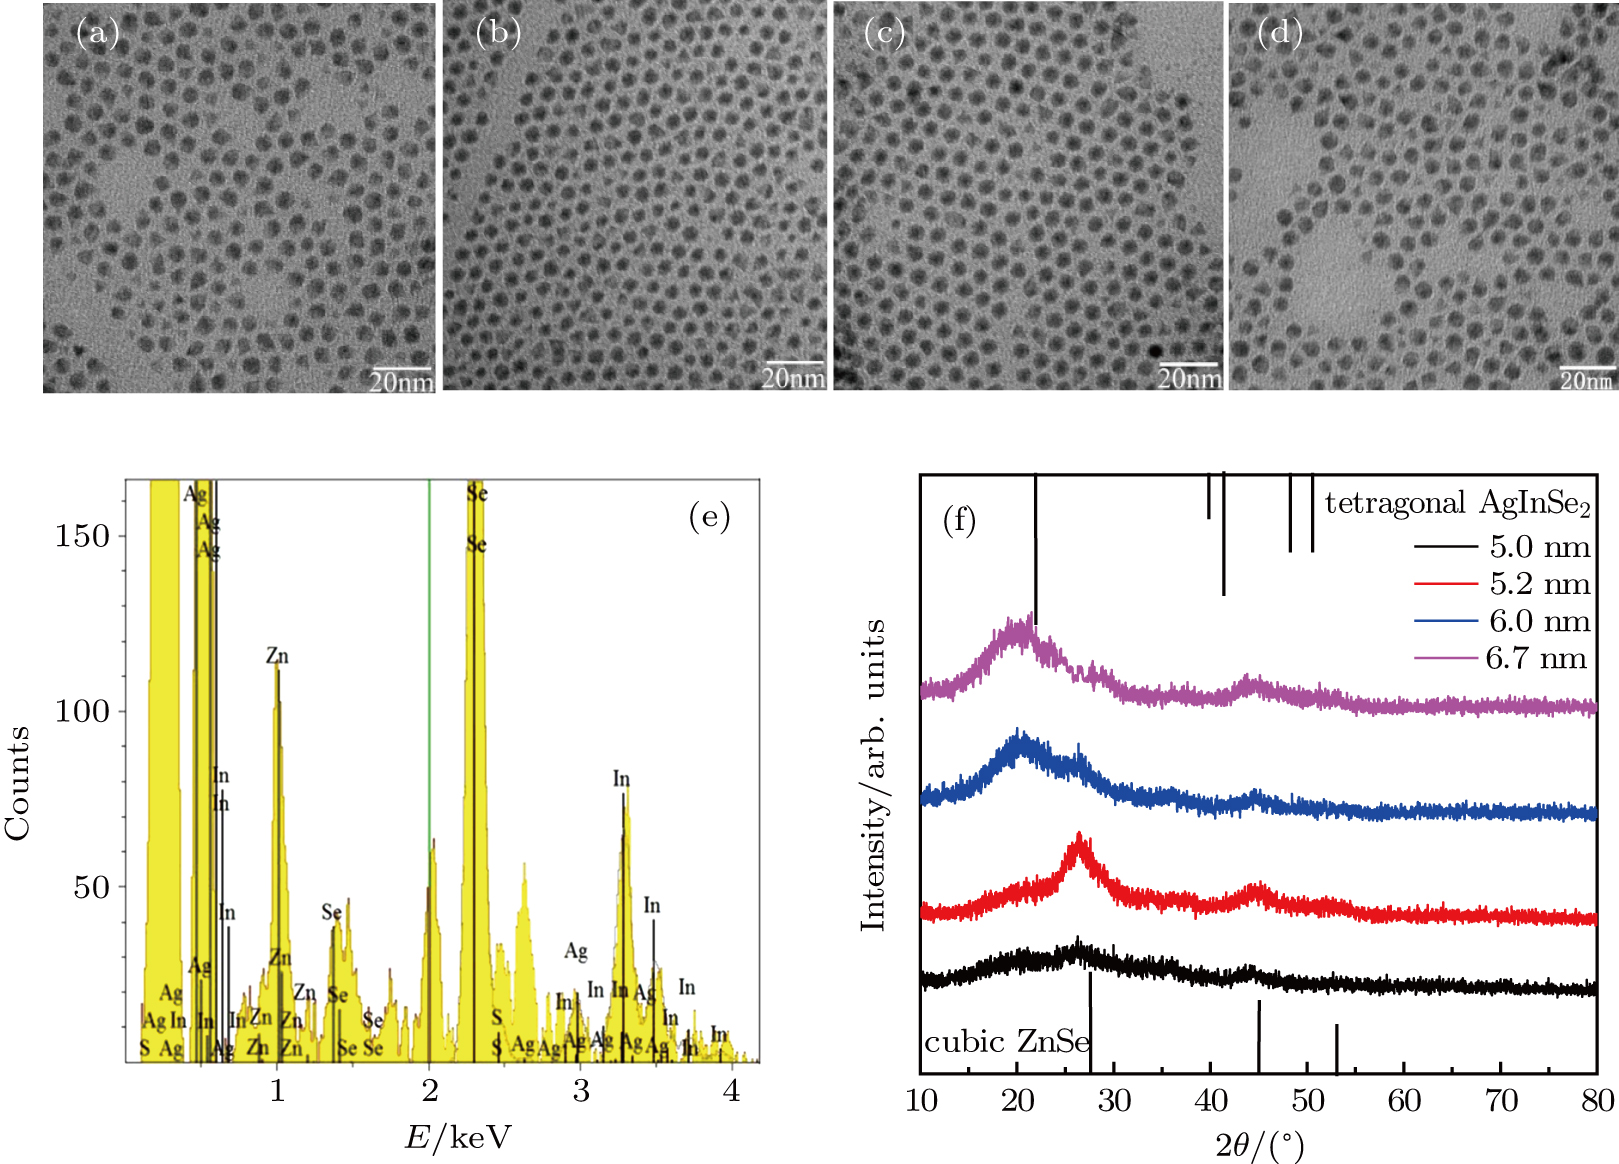
The transmission electron microscope (TEM) images of the ZAISe QDs with the different reaction times were shown in Figs. 
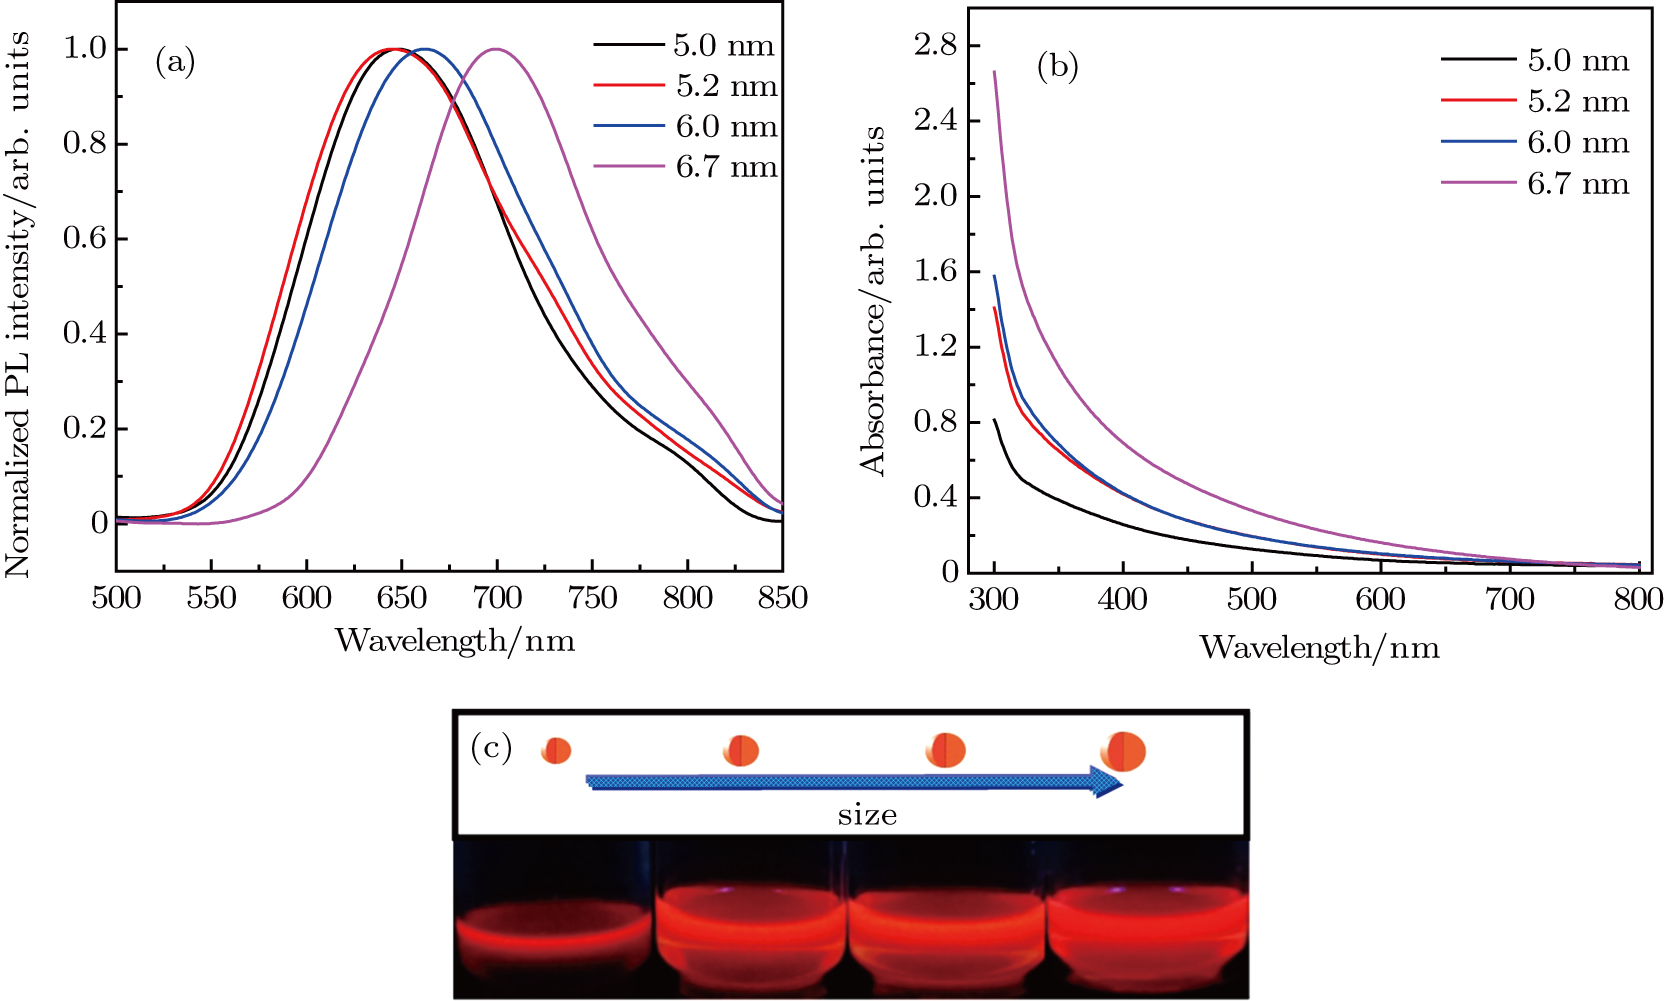
The normalized PL emission spectra and absorption spectra of the ZAISe QDs synthesized with different particle sizes are plotted in Figs.
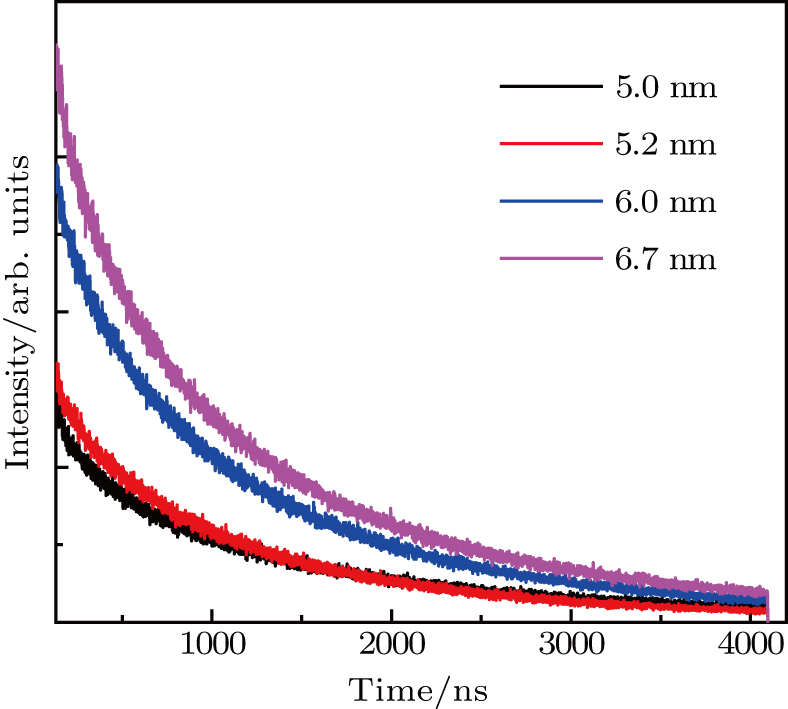
To study the luminescence mechanism, the PL decay curves of the ZAISe QDs excited by an LED with the wavelength of 367 nm are shown in Fig.
 |


| Table 1.
PL lifetime fitting parameters of ZAISe QDs with different particle sizes. . |
In ZAISe QDs, indium (


As shown in Fig.
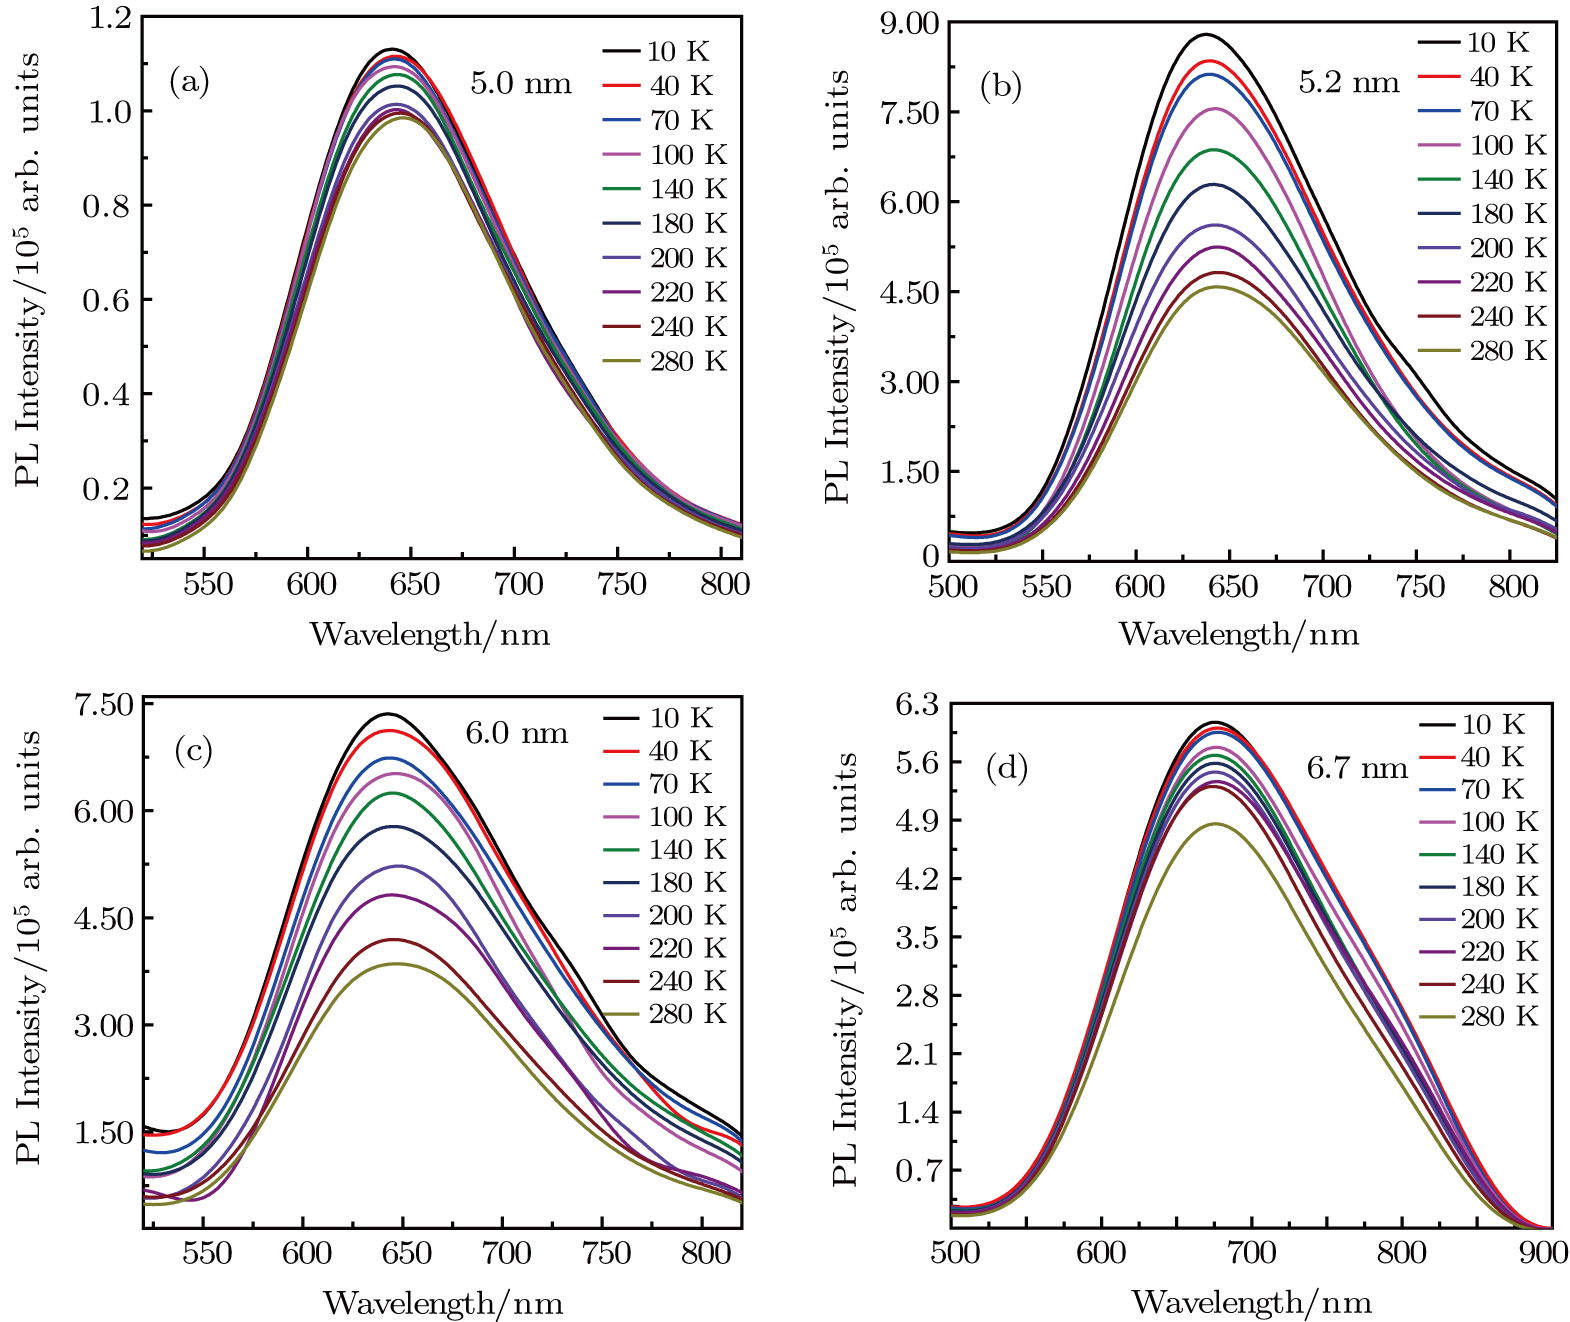 | Fig. 4. (color online) Temperature-dependent PL spectra of ZAISe QDs with different particle sizes (a) 5.0 nm; (b) 5.2 nm; (c) 6.0 nm; (d) 6.7 nm. |
In order to discern the nonradiative relaxation processes in the QDs, we analyzed the temperature dependence of the PL intensity of ZAISe QDs with different particle size, as shown in Fig.
 |


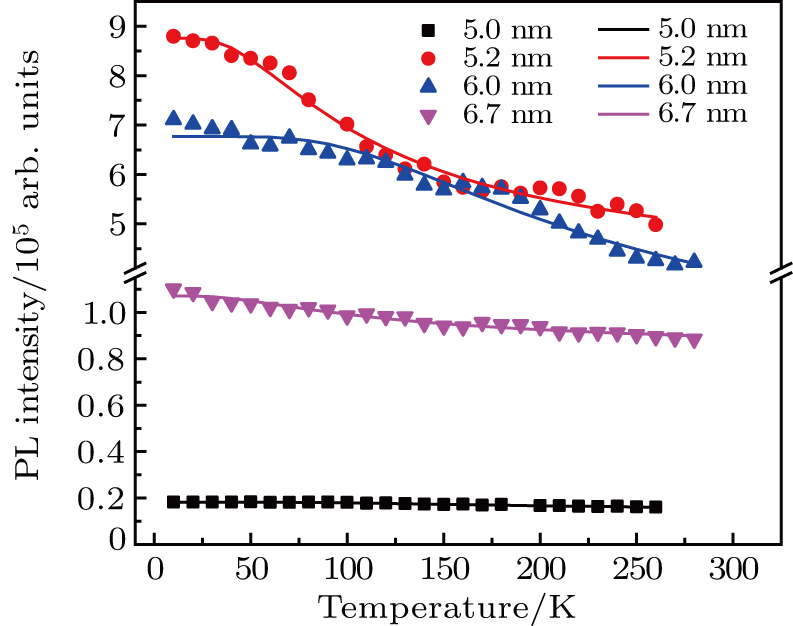 | Fig. 5. (color online) PL intensities of ZAISe QDS with different particle sizes as a function of temperature. The solid lines represent fitted curves based on Eq. ( |
| Table 2.
The fitted parameters of PL intensities of ZAISe QDs. . |
From the temperature-dependent PL spectra, the variation of peak position of ZAISe QDs with different particle size is shown in Fig.
 |


| Table 3.
The fitting results of temperature-dependent peaks energy of ZAISe QDs with different particle sizes are according to Eq. ( |
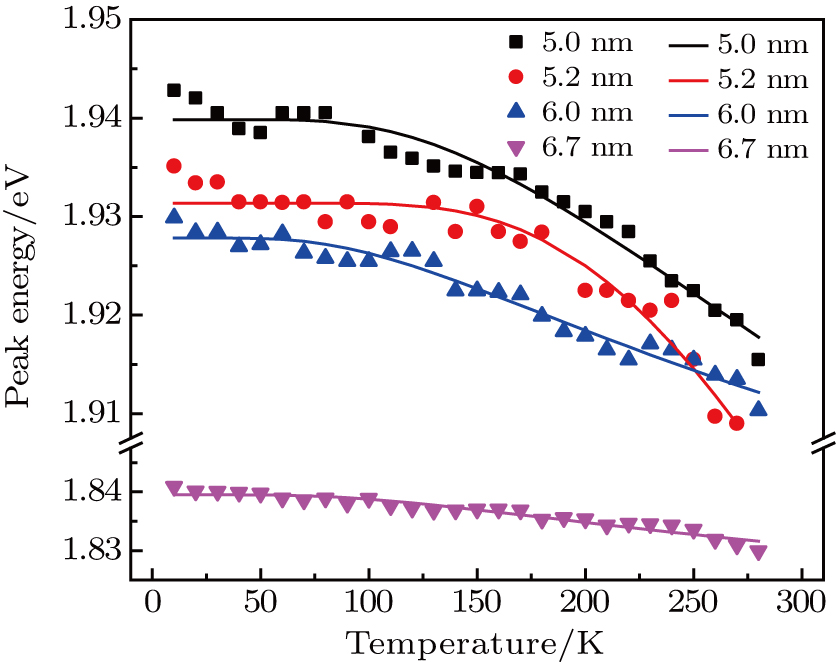 | Fig. 6. (color online) Temperature-dependent peak energy for ZAISe QDs with different particle sizes. The fitted curves (full lines) are on the basis of Eq. ( |
The full width at half-maximum (FWHM) of ZAISe QDs with different particle size all increases with increasing temperature, as shown in Fig.
 |


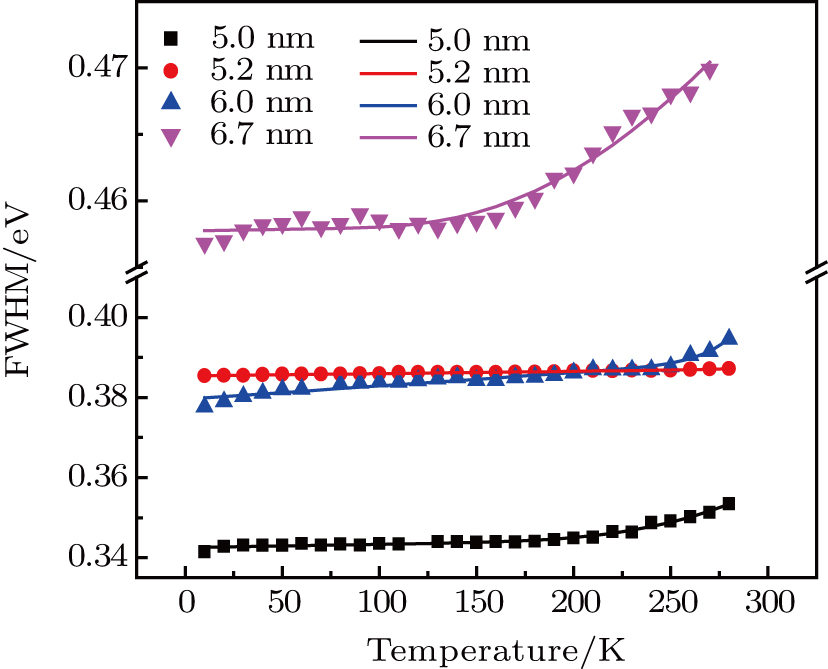 | Fig. 7. (color online) Temperature-dependent FWHM of the PL spectra for ZAISe QDs with different particle sizes. The fitted curves (solid lines) are fitted according to Eq. ( |
| Table 4.
The fitting parameters of temperature-dependent FWHM for ZAISe QDs with different particle sizes. . |
The ZAISe QDs with different particle sizes have been successfully synthesized in this paper. By changing the particle sizes, we have successfully tuned the PL of ZAISe QDs. The PL was red-shifted from 647 nm to 694 nm with increasing particle sizes, which depends on the quantum confinement effect. The luminescence mechanism of ZAISe QDs is contributed by the three processes including the conduction-band level to a localized intragap level, the surface-related recombination, and the donor to acceptor recombination from the time-resolved PL study. Through the temperature-dependent emission spectra of ZIASe QDs with different particle sizes, we verified the regular change of temperature-dependent PL intensity, peak energy, and the emission linewidth. Meanwhile, 


| [1] | |
| [2] | |
| [3] | |
| [4] | |
| [5] | |
| [6] | |
| [7] | |
| [8] | |
| [9] | |
| [10] | |
| [11] | |
| [12] | |
| [13] | |
| [14] | |
| [15] | |
| [16] | |
| [17] | |
| [18] | |
| [19] | |
| [20] | |
| [21] | |
| [22] | |
| [23] | |
| [24] | |
| [25] | |
| [26] | |
| [27] | |
| [28] | |
| [29] | |
| [30] | |
| [31] | |
| [32] | |
| [33] | |
| [34] | |
| [35] | |
| [36] | |
| [37] | |
| [38] | |
| [39] | |
| [40] | |
| [41] |


