† Corresponding author. E-mail:
An experimental system based on the background-oriented schlieren (BOS) technique is built to reconstruct the density and temperature distribution of a flame-induced distorted flow field which has a density gradient. The cross-correlation algorithm with sub-pixel accuracy is introduced and used to calculate the background-element displacement of a disturbed image and a fourth-order difference scheme is also developed to solve the Poisson equation. An experiment for a disturbed flow field caused by a burning candle is performed to validate the built BOS system and the results indicate that density and temperature distribution of the disturbed flow field can be reconstructed accurately. A notable conclusion is that in order to make the reconstructed results have a satisfactory accuracy, the inquiry step length should be less than the size of the interrogation window.
The density and temperature distribution of a flow field are the most important physical parameters because they essentially reflect the property of the fluid in the flow field. For example, the temperature distribution of a plume flow implies its infrared radiation feature, and the density fluctuation of a distorted flow field dominates the aero-optical effects of a beam passing through it.[1] The turbulent atmosphere has a great influence on the path of beam propagation due to the density gradient inside the atmosphere.[2] Thus, the development of diagnostic tools to obtain density and temperature information of a flow field has taken place in the area of aerodynamic research in the last few decades.[3,4] Generally speaking, the measurement techniques can be divided into two categories, that is, the intrusive and non-intrusive measurement. The intrusive measurement, such as thermocouples and pressure probes, can be used to measure the densities indirectly for constant pressure flows and isothermal flows.[5] However, they are essentially a point measurement technique. On the other hand, the non-intrusive measurement, such as the optical density measurement methods, has the advantage of capturing a complete two-dimensional (2D) density field. Most well-known optical density visualization techniques are schlieren photography, interferometry and shadowgraphy,[6] and all of these methods are based on line-of-sight integration of the variations in refraction index of the fluid within the measured volume. As a result, these techniques like schlieren and shadowgraph just provide qualitative information about the first and second derivative of density, respectively. Therefore, they are only suitable for the flow fields with relatively large jumps in density, such as shock waves. The major drawbacks of interferometry are the complexity in setting up such instrumentation and in fringe interpolation to determine the density fluctuations, which requires tremendous effort and care.[7] On the contrary, the instrumental requirement of the BOS technique is extremely modest. Usually, only one electronic camera, a background and a computer are needed. Other advantages of the BOS technique are its unlimited field of view and, consequently, its unlimited size of monitored objects.[8]
In recent years, the background-oriented schlieren (BOS) technique, first introduced by Meier and Dalziel,[9,10] has drawn attention as a novel measurement technique. The BOS technique is able to provide quantitative 2D density information,[7] and it also has a great potential for measuring a wide range of flows. Richard and Raffel[11] have successfully demonstrated the application of BOS to the large-scale density field measurement of helicopter-generated blade tip vortices. Unfortunately, neither theoretical nor numerical comparison with the measurements was given. Yamamoto et al.[12] used an ultra-high-speed imaging system based on the BOS technique to capture a laser-induced underwater shock wave. It indicated that the BOS technique is able to provide 2D density-gradient information about the flow field investigated and it only requires a simple setup. Venkatakrishnan[13] employed the BOS technique to obtain the mean density field of a complex under-expanded jet flow, and the presented density fields show that meaningful quantitative data can be extracted by using minimal hardware based on this technology. In addition, he also used the BOS technique to obtain quantitative density distribution of supersonic flow around a cone–cylinder model in a wind tunnel. Mizukaki[14] used the BOS technique combined with a high-speed video camera as the recording device to achieve flow visualization, and it was also applied to shock-induced flow near the open end of a shock tube.
From the applications of the BOS technique that are reviewed above, it is seen that the density measurement by using the BOS has been investigated widely. However, to the best of our knowledge, the application of the BOS technique to temperature visualization has been demonstrated rarely. The reason is that the BOS is essentially a technique to reflect the refractive index distribution of a distorted flow field, which only contains density rather than temperature information. That is, the density distribution of the distorted flow field, rather than the temperature distribution, can be obtained based on the famous Gladstone–Dale expression (see Eq. (
The rest of this paper is organized as follows. The BOS technique is introduced in Section
The principle of the BOS technique is based on the measurement of the deviation of a ray passing through a non-uniform object with a density gradient, which is similar to the conventional schlieren technique or specklegram technique. Actually, the BOS technique uses the local element displacement of a background image to detect the variation of refractive index of the non-uniform object due to its density gradient which is the first-order differential value of density. A schematic of the BOS technique is shown in Fig.
As illustrated in Fig.
Specifically, according to Venkatakrishnan and Meier,[7] the relationship between background-element displacement and refractive index gradient of the disturbed flow field is given by
 |
 |


 |
Using the law of Gladstone–Dale, the density can be directly related to the refractive index by
 |
 |


Generally speaking, the equipment for the BOS technique consists of a camera for recording images, a computer for the image analysis, and a background. For the background, its pattern which is generated by a computer is also an important factor for the BOS technique. Usually, there are three types of backgrounds used for the BOS technique, and a small fragment of each type is shown in Fig.
From Fig.
In this study, the cross-correlation algorithm is used to calculate the background-element displacement of the background in a distorted flow field. In addition, it is known that the calculated background-element displacement is the critical factor in reconstructing the density and temperature distribution of the distorted flow field (see Eq. (
According to the analysis given by Vinnichenko et al.,[17] the regular backgrounds have certain disadvantages because they show similar behaviors for their periods. If the displacement of an interrogation window is larger than or equal to the pattern period, two identical correlation peaks emerge and interrogation fails. For the wavelet-noise pattern, it is much more vulnerable with respect to blur than the background with randomly distributed dots, and it is usually employed by combining with the optical flow algorithm.[18] Actually, the background with irregular dots is used widely in the BOS technology and it is especially suitable for the cross-correlation algorithm. What is more, it has an optimal performance if the dot image size is approximately 3 pixels, and for this background the reconstructed density and temperature distribution are able to achieve satisfactory accuracy if the step length is less than the size of the interrogation window (see Subsection
The background-element displacement in the horizontal and the vertical direction (i.e., Δx and Δy) between a reference image and a disturbed image is calculated via two identical interrogation windows in both images by using the cross-correlation algorithm originally developed for PIV,[19] the schematic of cross-correlation algorithm is shown in Fig.
 |
The cross-correlation calculation is the core of the cross-correlation algorithm as given by Eq. (
The value of R(u, v) varies between 0 and 1. For R(u, v) = 0, it is an indication of no relationship between the two interrogation windows in both reference and disturbed images; whereas for R(u, v) = 1, it means that the two interrogation windows are exactly the same. As a matter of fact, for the two matching interrogation windows, the value of R(u, v) just approximately equals 1.0.
As mentioned above, the cross-correlation algorithm described above only produces pixel-level accuracy because the interrogation window is shifted by integer pixels for both horizontal and vertical directions in the disturbed image. To obtain the sub-pixel-level accuracy, one can either interpolate the cross-correlation surface to a higher resolution by using a 2D interpolation algorithm or fit a 2D analytical function to the cross-correlation surface around the peak.[20]
Actually, the cross-correlation surface around its peak usually approaches to a bell shape. Thus, in this paper, we use Gaussian fitting which has been tested successfully by empirical and theoretical researches to seek the more accurate peak position with sub-pixel-level. In the Gaussian fitting, the bell shape of the cross-correlation surface is assumed to fit a 2D Gaussian function,[21] and it is assumed that the two directions (i.e., x and y directions) are separable from and orthogonal to each other. For this reason, the sub-pixel-level peak location is calculated separately for the two directions by fitting a second-order polynomial to the direct neighbors of the point (x′, y′) as illustrated in Fig.
 |
 |
Then, the displacement of the point (x0, y0) that has sub-pixel-level precision in both horizontal and vertical directions is calculated by
 |
As revealed in Eqs. (
 |
If the background-element displacements (i.e., Δx and Δy) have been known, solving the Poisson equation (
There are many methods of solving the Poisson equation, and the well-known one is finite difference which has various iteration schemes. In this paper, a fourth-order difference scheme is developed to solve the Poisson equation. For a 2D computation plane, the discrete refraction index distribution around a point whose value is unknown can be shown in Fig.
 | Fig. 5. (color online) Schematic diagram of the discrete refraction index distribution in a 2D plane. |
Firstly, in order to deduce the fourth-order difference scheme, Taylor decomposition is applied to the eight external points. Taking the n1 and n5 for example, the decomposed results are given as follows:
 |
 |
The rest, such as n2, n3, n4, and n6, n7,n8, can be obtained easily by utilizing the symmetry of thesepoints. Then, we can obtain the following formulae:[22]
 |
 |
In order to deduce conveniently, the term on the right-hand side in Poisson equation (
 |
 |
Summing Eqs. (
 |
Secondly, the idea of undetermined coefficients is used to construct the desired difference scheme with fourth-order precision, which is written as
 |
 |
Comparing Eq. (
 |
It is easily found that equation (
 |
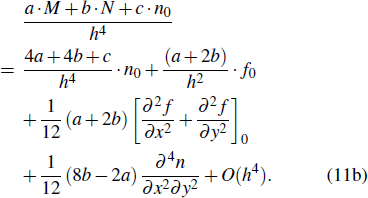
Finally, the final expression for the developed difference scheme with the fourth-order precision is given as
 |
Note that expression (
Because the refractive index distribution in a 2D computational plane can be obtained by solving the Poisson equation with the developed fourth-order difference scheme, then, the density distribution in the plane can be easily calculated by the Gladstone–Dale relation presented in Eq. (
 |
On the other hand, for the temperature distribution in the plane, it is difficult to solve exactly because the temperature is related to not only density but also pressure by the gas-state equation, given by
 |

However, for the open environment in which the gas movement is absolutely free, the hypothesis that the gas flow in this space is of iso-pressure is reasonable. Consequently, the temperature distribution in the computational plane can be calculated by using this hypothesis, that is,
 |
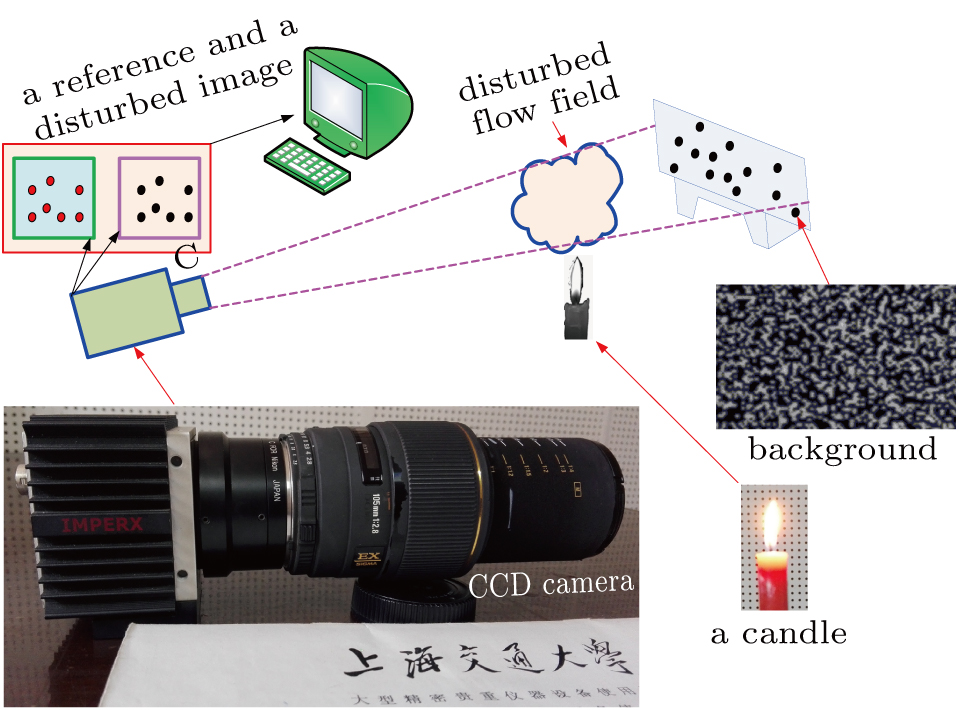
The experimental arrangement is shown in Fig.
As shown in Fig. 


As mentioned above, the procedure for reconstructing the density and temperature field of a flame-induced disturbed flow can be summarized as follows. First, the background-element displacements are calculated via a reference image and a disturbed image by using the cross-correlation algorithm at a sub-pixel-level. Second, the refractive index field is computed by solving the Poisson equation with the developed fourth-order difference scheme. Third, the density and temperature are reconstructed by utilizing Eqs. (
The temperature of the undisturbed flow field, namely the room temperature of our laboratory, is measured before the experiment and is about 300 K. On the other hand, the density of the undisturbed flow is obtained by inquiring the standard atmosphere parameters and it is about 1.161 kg/m3 in the present study. In order to validate the precision of the built BOS system, the undisturbed flow whose temperature and density have been measured is tested. According to the reconstruction procedure listed above, two reference images recorded at different time instants before experiment are used to reconstruct the density and temperature distribution of a 2D computational plane, such as the central plane of the undisturbed flow field, and the results are shown in Figs.
 | Fig. 7. (color online) The reconstructed temperature and density distribution of the undisturbed flow field, which are obtained by BOS from two reference images (d = 16 pixels). |
It is seen in Fig.
For the case of the disturbed flow field, the central plane of the disturbed flow field which is equivalent to the symmetrical plane of the flame is taken as the computational plane. As shown in Fig.
As shown in Fig.
Similarly, the reconstruction procedure listed above is applied to a reference image and a disturbed image to reconstruct the density and temperature distribution of the computational plane, and the reconstructed results are displayed in Fig.
 | Fig. 9. (color online) Reconstructed (a) density and (b) temperature distribution of disturbed flow field caused by a burning candle (d = 16 pixels). |
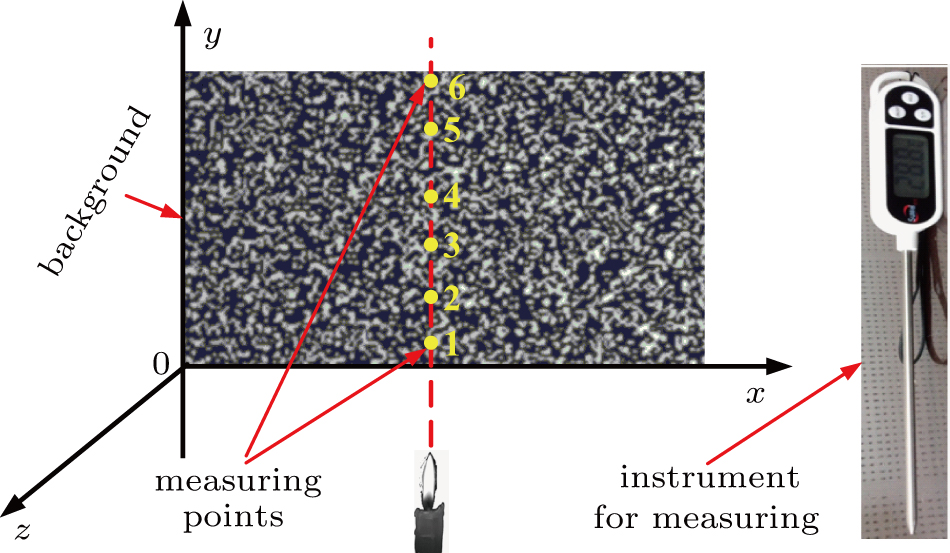
Taking the temperature distribution for example, six spots along the centre line are chosen as the measuring points for comparing the reconstructed temperatures along the centre line of the flame with those from manual measurements as shown in Fig.
 | Fig. 10. (color online) Schematic diagram of temperature measurement along the centre line of the flame. |
Table
| Table 1.
Comparison of temperature between reconstructed results and measurements for the six spots. Note: The measurement of every measuring spot is actually the average value over some measured temperatures at this measuring spot, and the distances of measuring spots from underneath the boundary of the background are about 141, 718, 1032, 1333, 1600, and 1950 pixels respectively. . |
As displayed in Fig.
 | Fig. 11. (color online) Schematic diagram of the interrogation windows arranged in a reference image. |
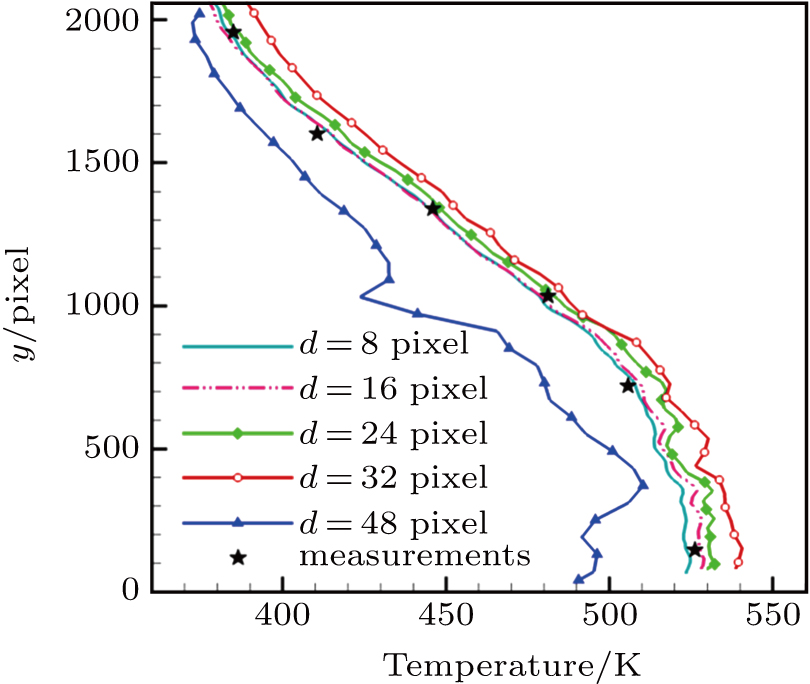
The values of constant d are set, respectively, to be 8, 16, 24, 32, and 48 pixels to explore the influence of step length on the reconstruction accuracy. Given the size of the interrogation window is 32 × 32 pixels, that is, the step length varies from 0.25 to 1.5 times the interrogation window in both horizontal and vertical directions. For each step length, the density and temperature distribution of the flame-induced disturbed flow field are reconstructed by the built BOS system. In order to compare quantitatively with measurements of temperature, only the temperature distribution along the centre line of the flame is extracted and presented. The comparison between reconstructed results and measurements is shown in Fig.
 | Fig. 12. (color online) Comparisons between measurements and reconstructed results for different steps. |
From Fig.
In this paper, we study the density and temperature reconstruction of a flame-induced disturbed flow field based on the BOS technique. Both the cross-correlation algorithm with sub-pixel accuracy and the fourth-order difference scheme are used to reconstruct the density and temperature distribution. An experiment is performed to validate the built BOS system, and the results clearly indicate that the density and temperature of the flame-induced disturbed flow field can be reconstructed exactly compared with manual measurements. In addition, the influence of step length on reconstruction accuracy is also discussed and it is found that the step length should be less than the size of the interrogation window in order to make the reconstructed result have a satisfactory precision.
| [1] | |
| [2] | |
| [3] | |
| [4] | |
| [5] | |
| [6] | |
| [7] | |
| [8] | |
| [9] | |
| [10] | |
| [11] | |
| [12] | |
| [13] | |
| [14] | |
| [15] | |
| [16] | |
| [17] | |
| [18] | |
| [19] | |
| [20] | |
| [21] | |
| [22] |


